PC Hardware Monitoring: The Complete Guide

Your CPU might be throttling right now and you'd never know.
Sustained temperatures above 85°C shorten CPU lifespan and tank performance — silently. GGFix watches every sensor (including the hotspot most tools hide) and alerts you the moment a reading drifts above its 30-day baseline, not just when it crosses a static threshold.
Start 3-Day Free TrialNo card required80% of IT outages are preventable with proactive monitoring. Equipment breakdown causes 42% of all unplanned downtime, and emergency repairs cost 3-5x more than planned maintenance. Yet most businesses have zero visibility into the hardware running their operations — no temperature data, no SMART history, no fan speed trends.
This guide covers everything you need to know about PC hardware monitoring in 2026: what it measures, why it matters, which sensors predict the most failures, and how to scale from one machine to a fleet of hundreds. It is the foundation of our entire hardware monitoring knowledge base. Each section links to detailed cluster posts where a single topic is covered in depth.
What Is PC Hardware Monitoring?
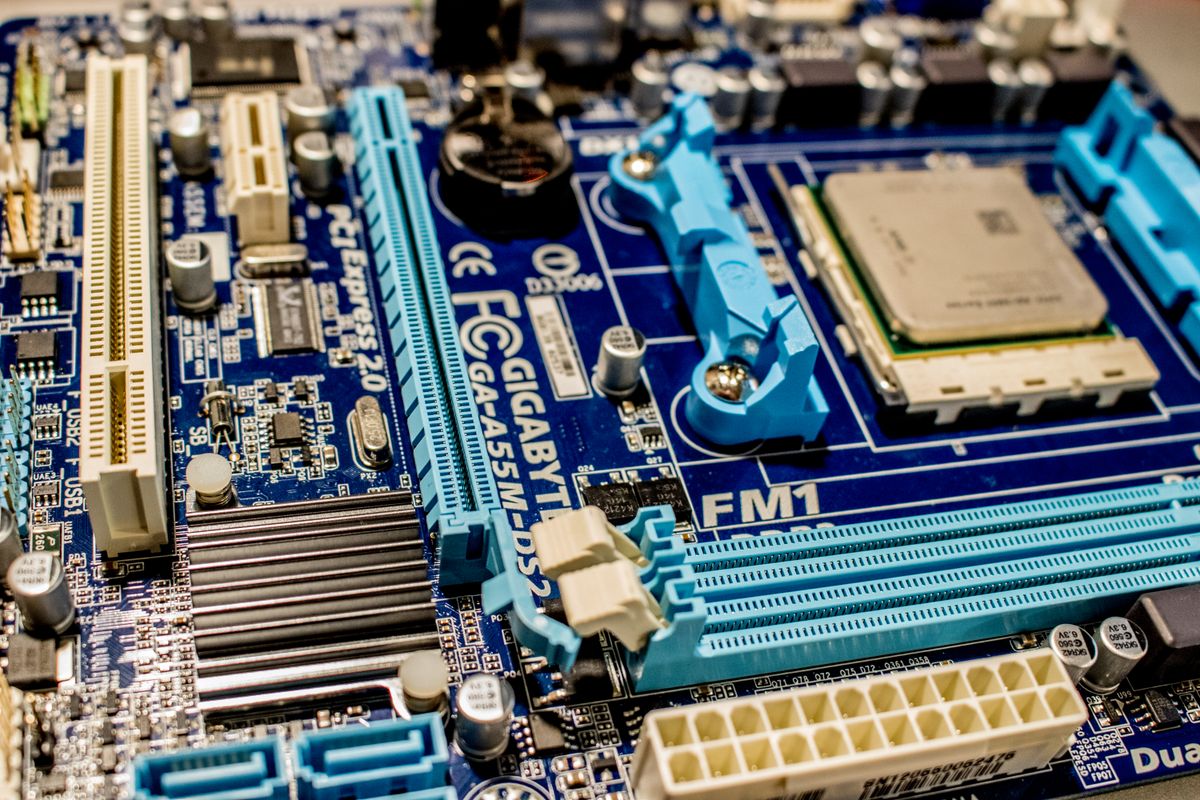
PC hardware monitoring is the process of continuously tracking a computer's physical components — CPU temperature, GPU load, disk health, RAM usage, fan speeds, and power draw — to detect problems before they cause crashes, data loss, or permanent hardware failure.
Hardware monitoring is distinct from software or OS monitoring. A server uptime tool tells you whether a machine is online. A hardware monitor tells you whether the CPU inside that machine is about to fail. Those are different questions with different answers, and confusing them is the most common and expensive mistake in IT operations.
After 8 years of repairing PCs in Copenhagen, the pattern is always the same: every catastrophic hardware failure we have seen had warning signs days or weeks before the final crash. A fan bearing getting louder. Temperatures climbing 2-3°C per week. SMART errors accumulating on a drive. The difference between a 200 DKK fan replacement and a 15,000 DKK emergency rebuild is whether someone was watching.
For a deeper explanation of why hardware monitoring matters beyond incident response, see our post on what hardware monitoring is and why every business needs it.
Why Traditional IT Monitoring Misses Hardware Failures
Most businesses already have some form of IT monitoring: network uptime checks, server availability pings, disk space alerts. These tools answer the question "is the machine working?" They cannot answer "is this machine about to fail?"
The gap is fundamental. OS-level monitoring reads metrics the operating system reports: CPU utilization percentage, available disk gigabytes, memory usage. These are software-layer abstractions. The hardware reality underneath can be completely different.
A machine can show 40% CPU utilization in your monitoring dashboard while simultaneously:
- Thermal throttling at 94°C, running at 30% of its rated clock speed
- Accumulating SMART reallocated sectors at a rate that predicts drive failure within 2 months
- Running a GPU at 87°C because the fan bearing has started to fail
None of those conditions appear in OS-level monitoring. They only appear in hardware sensor data. This is the gap that hardware monitoring fills.
For businesses, the hidden cost of not monitoring hardware compounds over time: machines run slower than they should, users report performance problems that look like software issues, and eventually a component fails catastrophically.
The 7 Sensors That Predict 90% of Hardware Failures
In our monitoring data across 500+ machines, failures almost always involve one of seven sensor categories. Monitor these consistently and you catch the overwhelming majority of hardware problems before they cause downtime.
For a complete breakdown of each sensor type, reading method, and what deviations mean in practice, see our 7 critical PC sensors guide.
1. CPU Temperature (Tdie / Tjunction)
The single most important hardware metric. Every modern CPU has a thermal junction maximum — Intel 13th/14th Gen at 100°C, AMD Ryzen 7000/9000 at 95°C — and sustained operation above 90% of that limit causes throttling, reduces component lifespan, and eventually causes thermal shutdown. The trend matters as much as the absolute value: a CPU that averaged 68°C under load last month and now averages 76°C under the same workload has a developing thermal problem, even if it has never exceeded any threshold.
For detailed temperature ranges by CPU generation and workload type, see our complete CPU temperature guide.
2. GPU Temperature (Edge and Hotspot)
GPUs are the most expensive component in most workstations. NVIDIA RTX 40 series GPUs begin thermal throttling at 83°C edge temperature. AMD Radeon GPUs report a junction (hotspot) temperature that is typically 15-25°C higher than the edge reading — a key distinction when interpreting alerts. In our monitoring data, GPU fan bearing wear is the most common cause of sudden GPU overheating, and it shows up weeks in advance as declining RPM before temperature spikes.
3. SSD Temperature and SMART Health
SSDs are the silent killers of system performance. Unlike CPUs and GPUs, which crash visibly when they overheat, SSDs just get slower — sometimes dropping from 7,000 MB/s to under 500 MB/s without any error message. Backblaze's quarterly drive reliability reports consistently show that SMART attributes Reallocated Sector Count (ID 5), Pending Sectors (ID 197), and Uncorrectable Sectors (ID 198) are the most predictive of imminent failure. Monitor all three continuously.
4. Fan Speeds (RPM)
Fans are mechanical. Mechanical parts wear out. A fan losing 200 RPM per month is a reliable predictor of failure within 8-12 weeks. Fan failures are the leading cause of thermal damage to otherwise healthy hardware: a GPU fan that seizes overnight at 3 AM during a render job can destroy a €1,000 GPU in under 30 minutes. Continuous fan RPM monitoring catches this before it reaches the critical threshold.
5. VRM Temperatures
The Voltage Regulator Module converts power for the CPU. On budget and mid-range motherboards under high-TDP processors, VRM temperatures can exceed 100°C under sustained load — causing random shutdowns, blue screens, and CPU throttling that looks identical to a CPU overheating problem. Most OS-level tools never report VRM temperatures. Hardware monitoring tools that read from the motherboard's embedded controller expose this metric.
6. RAM Usage and Errors
RAM failures cause the most confusing symptoms: random blue screens with different stop codes each time, application crashes that look software-related, and intermittent freezes that only happen under specific memory access patterns. Monitoring RAM usage trends identifies machines that are consistently at 90%+ utilization — a performance problem even without hardware failure. ECC-capable systems provide hardware-level error counting that can be monitored continuously.
7. Power Draw (Wattage)
A workstation that normally draws 350W at full load and now draws 280W under the same workload is a machine where something — a GPU, a CPU core, a drive — is throttling or has failed. Power draw is a fleet-level metric: when a group of machines suddenly drops in power consumption for the same workload, an environmental factor (ambient temperature, power quality) may be affecting multiple systems simultaneously.
How to Set Up Hardware Monitoring: A 7-Step Approach
Step 1: Identify What to Monitor
Focus on the 7 metrics above. Everything else is noise at the start. Add additional sensors after you have baselines for the critical ones.
Step 2: Establish Baselines
Run your typical workload for 5-7 days and record average and peak values for each sensor. These baselines are your reference — not manufacturer maximums. A machine that normally runs 15°C hotter than spec is not a problem if it has always run that way.
Step 3: Choose Your Tool
For a single personal PC, HWiNFO is the gold standard free option — it reads more sensor types than any other consumer tool. For a fleet, you need an agent-based solution that reports to a central dashboard without requiring physical access to each machine. The comparison of approaches is covered in detail in our hardware monitoring tools comparison.
Step 4: Set Alert Thresholds
Set thresholds based on your machine-specific baselines, not on manufacturer maximums. The exact values — by component type, CPU family, and workload category — are in our hardware monitoring alert thresholds guide.
Step 5: Automate Alerts and Reporting
An alert that requires you to log in to a dashboard to see it is not an alert — it is a report. Real monitoring fires notifications through Telegram, Slack, email, or webhook the moment a threshold is crossed or a trend deviation is detected, whether it is 2 PM or 2 AM. Manual checking defeats the purpose of continuous monitoring.
Step 6: Review Weekly, Not Daily
A weekly review of fleet health — average temperatures trending up or down, any drives accumulating SMART errors, fans losing RPM — catches slow-developing problems that never trigger any single threshold alert but show clear trajectories over time. This is the category of failure that kills machines: not sudden crashes but steady degradation.
Step 7: Scale to Fleet When Needed
A single PC is manageable with free tools. The moment you are responsible for 5 or more machines, you need centralized visibility, automated alerts, and trend analysis across the entire fleet. The approach changes significantly at scale — see our PC fleet management guide for the architecture that scales from 5 to 500 machines.
Real-Time vs. Periodic Monitoring: Which Is Right for Your Setup?
Hardware monitoring falls into two categories: continuous real-time monitoring that tracks sensor data every 30-60 seconds, and periodic checks that sample data on a schedule.
For individual workstations and small offices, periodic checks (every 15-30 minutes) are adequate for most metrics. For servers and high-value rendering machines, real-time monitoring matters — a server GPU that fails at 3 AM during a batch render can cause hours of damage in minutes.
For fleets managed by MSPs and IT departments, the combination of real-time alerts for acute events (temperature spikes, fan failures) and periodic data collection for trend analysis (daily SMART reads, weekly temperature averages) provides the best signal-to-noise ratio. Our dedicated post on real-time vs. periodic monitoring covers the trade-offs in detail.
Free Tools vs. Agent-Based Monitoring: Honest Comparison
| Feature | HWiNFO (Free) | RMM Tools | Agent-Based SaaS (GGFix) |
|---|---|---|---|
| Sensor depth | Excellent | Shallow — no thermals | Deep — CPU, GPU, SSD, VRM, fans, power |
| Remote monitoring | No | Yes | Yes |
| Automated alerts | No | Yes (basic thresholds) | Yes (AI-driven, trend-based) |
| Fleet management | No | Yes | Yes |
| AI anomaly detection | No | No | Yes |
| Setup time | 5 min per machine | 30-60 min per machine | 5 min per machine |
| Cost per machine | Free | $3-7/device/month | ~$12/device/month |
HWiNFO is the right answer for a single machine with a human watching it. It is the wrong answer for any unattended machine, any fleet, or any situation where alerts need to fire without someone being physically present. See our open-source vs. commercial monitoring comparison for a detailed breakdown.
Why Monitoring Matters: The Cost of Hardware Failure
The economics of hardware monitoring are direct: monitoring is cheap, failure is expensive. The question is whether the gap is large enough to justify the overhead.
| Scenario | Cost Without Monitoring | Cost With Monitoring |
|---|---|---|
| Fan fails, GPU overheats | $800-2,000 GPU replacement + 4h downtime | $25 fan replacement, scheduled |
| SSD fails undetected | Data loss, 4-8h recovery, possible drive replacement | Drive replaced at 80% health, no data loss |
| VRM throttling | Months of degraded performance, early CPU failure | Thermal maintenance scheduled |
| Fleet-wide ambient temp increase | Multiple machines fail in same week | Single alert, single response |
For creative studios running DaVinci Resolve, Blender, or After Effects, the downtime math is even more severe. Our analysis of workstation overheating costs for creative studios quantifies this in project-delay terms.
AI-Powered Monitoring: Beyond Simple Thresholds
Traditional monitoring sets a fixed threshold and fires when the line is crossed. This works for acute failures. It misses gradual degradation.
AI-powered monitoring watches patterns over time. A CPU that ran at 62°C average load temperature last month and now averages 70°C under the same workload has not crossed any threshold — but the 8°C drift in 30 days signals a cooling problem that will reach the critical threshold within 4-8 weeks. An AI system catches this and flags it weeks before the threshold alert would fire.
In our monitoring fleet, AI-driven anomaly detection catches approximately 3x more actionable issues than static threshold alerts. GGFix uses Claude AI to analyze sensor patterns across time, generates natural-language alerts explaining what the anomaly means and what action is recommended, and produces weekly fleet health digests that a non-technical manager can act on without IT interpretation. See our dedicated post on how AI is changing hardware monitoring in 2026 for a detailed breakdown of the pattern-recognition approaches.
Frequently Asked Questions
Q: Is it safe to run hardware monitoring software all the time?
Yes. GGFix's agent uses approximately 15 MB of RAM and less than 1% CPU at all times. Sensor reading is a passive operation: the hardware reports its own data to the monitoring software, which simply reads it. The monitoring agent does not perform any writes to the hardware, does not modify system configuration, and does not interact with user data.
Q: What temperature is too hot for a CPU?
It depends on the specific CPU model and workload. Intel 13th/14th Gen processors have a maximum junction temperature of 100°C, with throttling beginning around 90-95°C. AMD Ryzen 7000/9000 series has a Tjmax of 95°C and intentionally operates near that limit under boost workloads. "Too hot" for monitoring purposes is relative to your machine-specific baseline — a CPU that usually runs at 75°C under load and now runs at 83°C has a problem, even if 83°C is within spec. See our CPU temperature guide for detailed ranges by generation.
Q: Can I monitor multiple PCs from one dashboard?
Yes, but not with free consumer tools like HWiNFO, which are single-machine only and require physical access to the machine to read data. Fleet monitoring solutions like GGFix deploy an agent on each Windows machine and surface all sensor data on a central dashboard with real-time status, alerts, and weekly AI health reports — accessible from anywhere without remote desktop access.
Q: Does hardware monitoring prevent failures or just predict them?
Monitoring predicts failures — it does not physically prevent them. But prediction enables prevention. If monitoring shows a fan losing RPM over three weeks, you replace the 200 DKK fan before the 8,000 DKK GPU it cools is destroyed. If monitoring shows SMART reallocated sectors climbing, you replace the drive before it fails and takes data with it. According to industry research, 70% of equipment failures follow predictable patterns detectable weeks in advance, and proactive maintenance extends equipment life by 25-35%.
Q: What is the difference between hardware monitoring and RMM tools?
RMM (Remote Monitoring and Management) tools monitor OS-level metrics: CPU usage percentage, disk free space, service uptime, network availability. Hardware monitoring reads the physical sensor layer beneath the OS: actual CPU core temperatures, SMART disk health scores, GPU hotspot temperatures, fan RPMs, and VRM temperatures. A machine can appear completely healthy in an RMM dashboard while thermal throttling, accumulating drive errors, and running a dying fan. Hardware monitoring and RMM serve different purposes and are best used together.
Q: How quickly does hardware monitoring pay for itself?
At 89 DKK/machine/month, GGFix costs approximately 1,068 DKK/machine/year. A single prevented hard drive failure — including data recovery, emergency replacement, and downtime — typically costs 5,000-15,000 DKK. One prevented failure per machine pays for 5-14 years of monitoring. For most business machines, a drive failure or GPU failure occurs at least once every 3-5 years statistically, making the ROI positive from the first prevented incident.
Is your PC throttling under load without telling you?
GGFix watches every temperature sensor — including the GPU hotspot most tools hide — and catches thermal problems before components degrade. AI alerts name which workload caused the spike.
- 3-day free trial — no credit card, 1 machine included
- Installs silently as a Windows Service (2 minutes)
- 50+ sensors + top 25 processes monitored every minute
- Auto-decodes BSODs and Event IDs 41 / 1001 / 219 / WHEA
- AI names the exact app that caused any crash or spike
- Telegram or email alerts in under 10 seconds
| Scenario | Typical cost (USD) |
|---|---|
| CPU/GPU replacement after thermal failure | $400 – $2,500 |
| Emergency technician callout | $120 – $350 |
| Lost workday (thermal throttling undetected) | $200 – $600 |
| Thermal paste + cleaning (early warning) | $30 – $100 |
| GGFix monitoring (per machine / month) | $20 |
| GGFix monitoring (per machine / year — 2 months free) | $200 |
Early warning is the cheapest insurance you can buy. GGFix catches problems when the fix is still cheap — and names the exact app, sensor, or BSOD code responsible.
On-site PC & laptop repair · Copenhagen
In Copenhagen with this exact problem? GGFix fixes it hands-on — often cheaper than replacing the machine.
Fixed prices from 399 DKK for on-site PC and laptop repair, all brands, on-site or drop-off in Ishøj — with an honest diagnosis before you commit to anything.
See on-site PC and laptop repair pricesGGFix Technical Team
Writing about hardware monitoring, fleet management, and keeping machines alive. Powered by GGFix.
Related Articles
PSU Failure Signs: When Your Power Supply Is Dying
A dying PSU is the most misdiagnosed component in PC repair. Voltage instability, load-specific crashes, and USB dropouts are the real warning signs — here is what the ATX spec requires, how long quality units actually last, and which diagnostic tools work.
The Real Cost of Hardware Failure: A Business Impact Analysis
Hardware failure costs 5-10x the price of the broken component when you count downtime, lost productivity, data recovery, and emergency labor. This analysis breaks down the real numbers for small and mid-sized businesses.
PC Troubleshooting Guide: Diagnose and Fix Hardware Problems
The complete starting point for diagnosing PC hardware problems. Covers every major symptom and component failure, with step-by-step diagnostic approaches and links to in-depth guides.
[ free 3-day trial · no credit card ]
Know before it breaks.
GGFix installs in 2 minutes and starts watching your hardware immediately — CPU temps, GPU load, disk health, fan speeds, and 50+ sensors. AI tells you what's wrong before it causes damage.