Server Room Monitoring: Temperature, Humidity, and Power

Your CPU might be throttling right now and you'd never know.
Sustained temperatures above 85°C shorten CPU lifespan and tank performance — silently. GGFix watches every sensor (including the hotspot most tools hide) and alerts you the moment a reading drifts above its 30-day baseline, not just when it crosses a static threshold.
Start 3-Day Free TrialNo card requiredMost server room failures are preventable. The AC unit that failed at 3 AM took 20 minutes to raise the rack to 45°C and begin shutting down servers. Those 20 minutes were visible in temperature sensor data from the moment the AC stopped working — but nobody was watching. The failure cost 4 hours of unplanned downtime, a replacement AC unit, and an emergency IT call-out. A $200 environmental sensor and an alert configuration would have triggered a Telegram message at the 5-minute mark, when there was still time to respond before hardware was at risk.
This post is part of our hardware monitoring by industry guide. For predictive maintenance strategy, see our IT predictive maintenance guide.
What Needs Monitoring in a Server Room
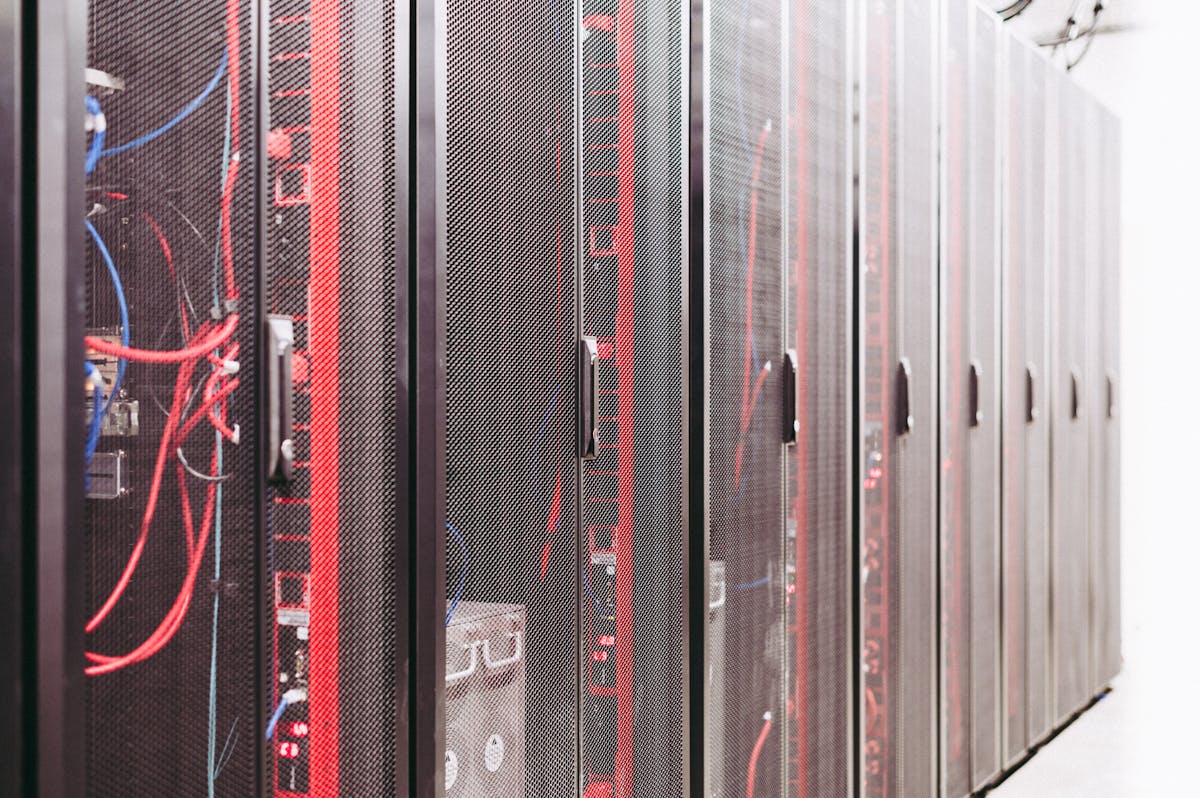
Server room monitoring spans three categories: environmental, hardware, and power. Each addresses a different failure mode.
Environmental Monitoring
Temperature: The primary server room metric. ASHRAE Technical Committee 9.9 recommends inlet air temperature of 18–27°C (A1 class equipment) for most commercial server hardware. Above 27°C inlet, servers run hotter. Above 35°C, most server hardware begins throttling. Above 40°C, hardware shutdown protection mechanisms activate.
For small business server rooms without raised floors and hot-aisle/cold-aisle containment, temperature distribution is uneven. A rack's top unit may be 8–12°C hotter than the bottom unit due to heat stratification. Single-point temperature measurement misses this gradient.
Humidity: The often-neglected metric. ASHRAE recommends 8–80% relative humidity (non-condensing) for A1/A2 class server environments. Low humidity (<20% RH) creates static electricity risks — ESD events that damage DRAM, storage controllers, and NIC chips. High humidity (>80% RH) risks condensation on circuit boards, causing short circuits. In regions with significant seasonal humidity variation, a server room without humidity control can swing from 15% RH in a dry winter to 75% RH in a humid summer.
Airflow: Restricted airflow is often the root cause of server overheating even when room temperature appears acceptable. Blocked cable runs, missing blanking panels in racks, and poor rack positioning can create hot spots that environmental sensors miss.
Hardware Monitoring for Server Equipment
Windows Servers running business applications benefit from the same hardware monitoring as workstations: CPU temperature, drive health (S.M.A.R.T.), fan speeds, and voltage rail stability. GGFix's agent installs on Windows Server 2019/2022 editions and provides the same telemetry as on workstation hardware.
For Windows-based servers in small-to-medium business environments, GGFix covers:
- CPU temperature across all physical cores
- System fan speeds (chassis fans and CPU fans)
- Drive health for all connected SATA/NVMe storage
- Voltage rail stability (+12V, +5V, +3.3V)
- System uptime and restart events
For more comprehensive monitoring including IPMI/BIOS-level out-of-band monitoring, enterprise systems offer IPMI/BMC access that operates independently of the OS. This is outside GGFix's current scope but is relevant for dedicated server hardware.
Power Monitoring
UPS status: Uninterruptible power supplies are the single most important protection mechanism for server hardware. A UPS that fails silently — batteries degraded to 20% capacity without anyone knowing — provides almost no protection. UPS monitoring should include battery charge level, battery age, and load percentage. Most modern UPS units support network management cards that report these metrics via SNMP.
Power consumption trending: Sudden increases in server power consumption with no corresponding increase in workload indicate hardware inefficiency or runaway processes. Monitoring power consumption over time establishes baseline expectations.
Dual power supply balance: For servers with dual PSUs, monitoring ensures both PSUs are carrying load. A server running on a single PSU without knowing it has lost its redundancy without any operational impact being visible.
ASHRAE Temperature Standards for Server Rooms
For small business server rooms, the relevant ASHRAE standard is TC 9.9 A1/A2 class:
| Condition | A1 Class | A2 Class |
|---|---|---|
| Inlet temperature range | 15–32°C | 10–35°C |
| Humidity | 20–80% RH | 20–80% RH |
| Maximum dew point | 17°C | 21°C |
Most small business servers (Dell PowerEdge, HPE ProLiant, Lenovo ThinkSystem) are rated to A2 class. Alerting at 33°C room temperature (above A2 upper limit) gives a response window before hardware is at risk.
Common Failure Scenarios and Monitoring Response
AC failure: Room temperature rises from 22°C toward 35°C over 20–30 minutes. Alert at 28°C gives approximately 10–15 minutes to respond before hardware is at thermal risk. Response: open server room door to allow office AC to assist, call AC vendor, begin graceful server shutdown if temperature continues rising.
AC running but inadequate: Temperature gradually increases over days or weeks rather than acutely. Root cause: AC undersized for current heat load, filter blockage, or refrigerant depletion. Monitoring catches this as a slow drift above historical baseline. Response: AC maintenance, check and replace filters, assess whether AC capacity matches current equipment heat load.
Humidity too low in winter: In cold climates with central heating, server rooms without humidity management can drop below 20% RH. Alert at 25% RH. Response: add a humidifier to the server room, ensure ESD precautions are in place for any physical work in the room.
Drive failure progression: S.M.A.R.T. monitoring on server storage shows reallocated sectors appearing or wear level crossing 70%. Response: schedule drive replacement in the next maintenance window, verify backup integrity before touching the failing drive, replace during lowest-risk business hours.
Practical Implementation for Small Business Server Rooms
For a small business with a dedicated server room (1–3 server racks, typically 3–20 physical machines including switches and storage), a practical monitoring setup:
Layer 1 — Environmental: A dedicated environmental monitor (e.g., Papouch or similar network-connected temperature/humidity sensor) connected to the network. These devices report via SNMP or HTTP. Alert configuration: temperature above 28°C, humidity below 25% or above 75%.
Layer 2 — Server hardware: GGFix agent deployed on all Windows servers. Covers CPU temperatures, drive health, fan speeds, and voltage rails for the Windows-based equipment.
Layer 3 — Power: UPS network management card configured to report battery status, load percentage, and grid power events via email/SNMP. Alert: battery below 80% charge, load above 80% capacity.
Alert routing: All three layers feed to a central notification channel (Telegram or Slack). On-call IT contact receives immediate notification for any critical alert.
For managing a server room alongside a broader PC fleet, GGFix's fleet dashboard presents all monitored machines in a single view — servers and workstations together, or segmented by room/type based on how you organize the fleet.
Frequently Asked Questions
What temperature should a server room be kept at?
ASHRAE recommends inlet air temperature of 18–27°C for standard server hardware (A1 class) and 10–35°C for A2 class hardware. Most small business server rooms target 18–22°C as the operating range, with alerts configured at 27°C (warning) and 32°C (critical). Temperatures above 35°C risk hardware shutdown and potential damage to storage media.
How often should server room temperature be checked?
For any business-critical server environment, temperature should be monitored continuously with automated alerting — not checked on a weekly walk-through. The failure scenario (AC stops working overnight) cannot be caught by periodic checks. Continuous monitoring with 5-minute alert latency is the minimum for any server room where hardware failure causes significant business impact.
Does humidity really matter for a small server room?
Yes. Low humidity (<20% RH) is a static electricity risk — any physical work in the server room becomes ESD-hazardous, and spontaneous ESD events can occur without physical contact in very dry conditions. High humidity (>75% RH) risks condensation on circuit boards during temperature changes. A $50 digital hygrometer is sufficient for awareness; a networked sensor with alerting provides actual protection.
Can GGFix monitor network switches and non-Windows hardware?
GGFix's agent requires Windows. Network switches, NAS devices, Linux servers, and non-Windows hardware require alternative monitoring tools (SNMP-based monitoring, vendor-specific management software, or an open-source tool like Prometheus with node_exporter). GGFix coexists with these tools — it handles Windows hardware sensor monitoring while other tools cover non-Windows infrastructure.
What is the most common cause of unplanned server room downtime in small businesses?
In our experience, the most common causes are: AC failure without alerting (leading to thermal shutdown), drive failure on aging servers without RAID or with failed RAID (no redundancy), and power supply failure in older servers that have been running for 5+ years. All three are detectable — thermal trends before AC failure, S.M.A.R.T. data before drive failure, voltage anomalies before PSU failure. Continuous monitoring addresses all three.
Is your PC throttling under load without telling you?
GGFix watches every temperature sensor — including the GPU hotspot most tools hide — and catches thermal problems before components degrade. AI alerts name which workload caused the spike.
- 3-day free trial — no credit card, 1 machine included
- Installs silently as a Windows Service (2 minutes)
- 50+ sensors + top 25 processes monitored every minute
- Auto-decodes BSODs and Event IDs 41 / 1001 / 219 / WHEA
- AI names the exact app that caused any crash or spike
- Telegram or email alerts in under 10 seconds
| Scenario | Typical cost (USD) |
|---|---|
| CPU/GPU replacement after thermal failure | $400 – $2,500 |
| Emergency technician callout | $120 – $350 |
| Lost workday (thermal throttling undetected) | $200 – $600 |
| Thermal paste + cleaning (early warning) | $30 – $100 |
| GGFix monitoring (per machine / month) | $20 |
| GGFix monitoring (per machine / year — 2 months free) | $200 |
Early warning is the cheapest insurance you can buy. GGFix catches problems when the fix is still cheap — and names the exact app, sensor, or BSOD code responsible.
On-site PC & laptop repair · Copenhagen
In Copenhagen with this exact problem? GGFix fixes it hands-on — often cheaper than replacing the machine.
Fixed prices from 399 DKK for on-site PC and laptop repair, all brands, on-site or drop-off in Ishøj — with an honest diagnosis before you commit to anything.
See on-site PC and laptop repair pricesWriting about hardware monitoring, fleet management, and keeping machines alive. Powered by GGFix.
Related Articles
GPU Artifacts: What They Look Like and What Causes Them
GPU artifacts range from fixable driver issues to signs of permanent VRAM damage. Here is how to identify which type you have, what temperatures trigger them, and whether your graphics card is recoverable.
PC Maintenance Schedule: The Complete Checklist (Daily to Annual)
The complete PC maintenance schedule for businesses — weekly, monthly, quarterly, and annual tasks with time estimates, environment adjustments, and the real cost of skipping it.
NVIDIA RTX 4060–5090: Temperature Limits by Model
RTX 4090 and RTX 5090 have different temperature limits. The hotspot temperature runs 15-25°C above the core temperature every card reports. Most monitoring setups only watch the core — which means most monitoring misses the actual failure threshold. Here are the exact numbers for every RTX card.
[ free 3-day trial · no credit card ]
Know before it breaks.
GGFix installs in 2 minutes and starts watching your hardware immediately — CPU temps, GPU load, disk health, fan speeds, and 50+ sensors. AI tells you what's wrong before it causes damage.