PRTG vs HWiNFO vs Open Hardware Monitor: Which Is Right for Your Fleet?
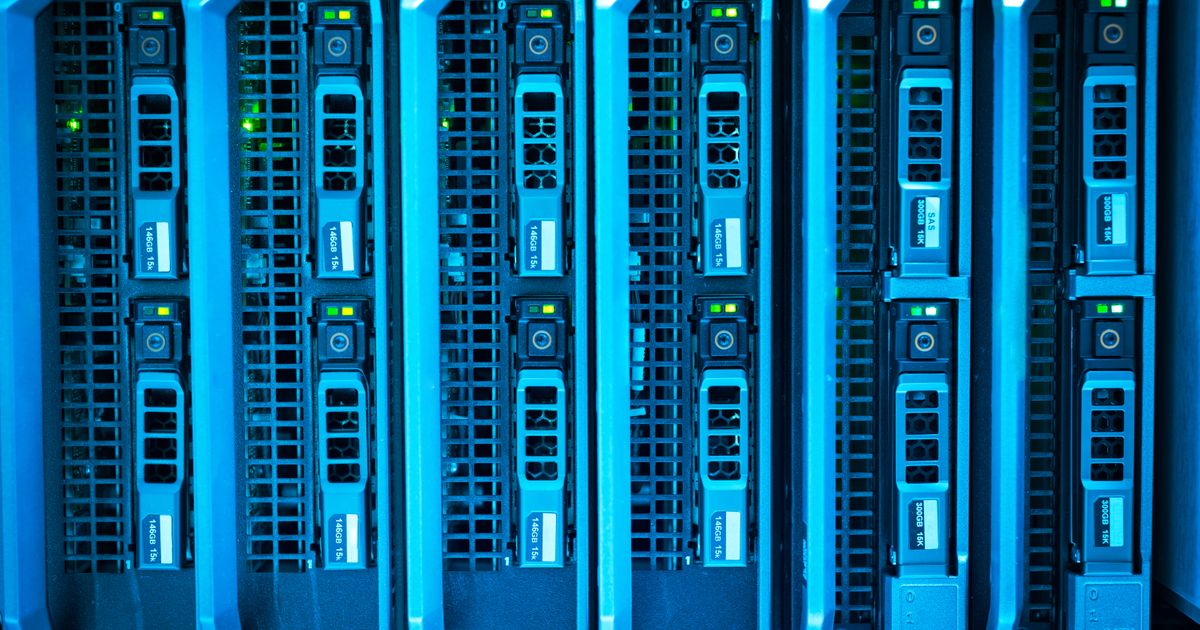
Your hardware is degrading. The question is whether you find out first.
GGFix monitors 50+ sensors per machine, tracks the top 25 processes every minute, decodes every BSOD into plain English, and alerts you in under 10 seconds — before degradation turns into a failure, a repair bill, or lost work.
Start 3-Day Free TrialNo card requiredThree tools dominate hardware monitoring discussions: PRTG Network Monitor, HWiNFO, and Open Hardware Monitor (and its fork, LibreHardwareMonitor). They are frequently compared as alternatives to each other — but they solve fundamentally different problems. PRTG is an enterprise network monitoring platform. HWiNFO is a local hardware diagnostic tool. Open Hardware Monitor is an open-source sensor reader. Using any of them interchangeably reflects a misunderstanding of what each does well and what each cannot do at all.
This comparison covers the specific capabilities and limitations of each tool, with honest assessments of where they fit and where they fall short — including where purpose-built AI monitoring like GGFix fits relative to each.
For a broader overview of the hardware monitoring tool landscape, see our complete hardware monitoring guide.
PRTG Network Monitor
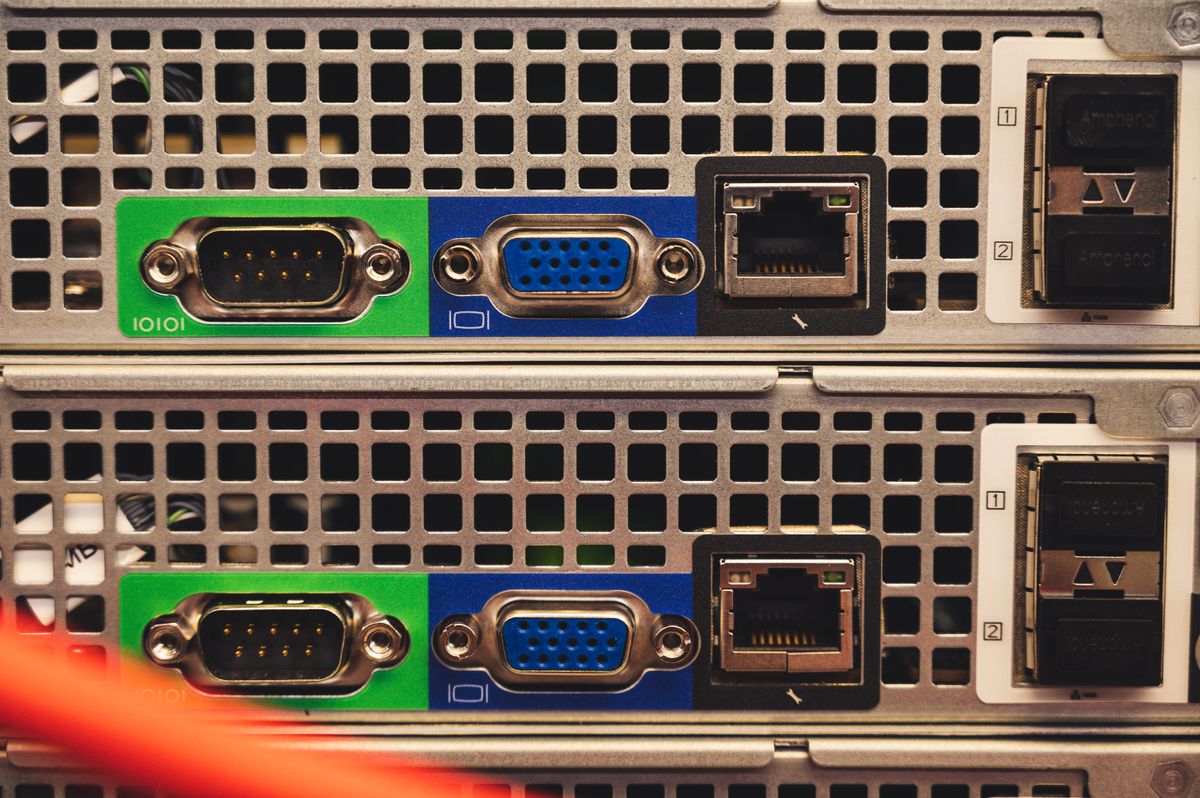
What it is: Paessler PRTG is an enterprise network and infrastructure monitoring platform. It monitors network devices (switches, routers), servers via SNMP and WMI, applications, bandwidth, and uptime. It is not designed as a primary hardware sensor monitoring tool.
What it does well:
- Network topology and bandwidth monitoring
- SNMP-based monitoring of managed network equipment
- Windows server monitoring via WMI (CPU utilization, disk space, services)
- Uptime and availability monitoring with alerting
- Enterprise-scale deployments with thousands of sensors
- Historical trending and reporting
What it misses for hardware monitoring:
- PRTG does not read deep hardware sensor data by default. It reads CPU utilization via WMI but not CPU temperature, GPU temperature, fan speeds, VRM temperatures, or S.M.A.R.T. storage health without custom sensors or third-party plugins.
- Custom hardware sensor plugins for PRTG exist but require PowerShell scripting experience and LibreHardwareMonitor as a backend, adding significant setup complexity.
- No AI analysis or anomaly detection — PRTG is threshold-based only.
- Per-machine hardware baselines do not exist — thresholds must be manually configured for every sensor on every machine.
- Designed for network engineers, not IT technicians managing PC fleets.
Pricing: PRTG is licensed per sensor. The free tier allows 100 sensors (inadequate for hardware monitoring a fleet of any meaningful size). For 5,000 sensors (required for comprehensive hardware monitoring of ~50 machines), PRTG costs approximately $1,800–3,500/year depending on license type.
Best suited for: Enterprise IT teams needing unified network + server monitoring. Not appropriate as a primary tool for PC fleet hardware sensor monitoring.
HWiNFO
What it is: HWiNFO (and its predecessor HWMonitor) is a Windows hardware diagnostic utility. It reads every available hardware sensor on a local machine and displays the data in real time. It is arguably the most comprehensive local hardware sensor reader available for Windows.
What it does well:
- Reads virtually every sensor accessible on Windows hardware: CPU package and core temperatures, GPU core/VRAM/hotspot temperatures, fan speeds (all fans), voltage rails, power draw, clock speeds, PCIe link state
- Free for personal use (HWiNFO Pro adds logging features for $25)
- Accurate, trustworthy sensor data used by hardware reviewers worldwide
- Can log data to CSV for later analysis
- Supports Remote Sensor Monitor (RTSS) integration for OSD overlays
What it misses for fleet monitoring:
- Local machine only — data stays on the machine unless manually exported
- No fleet dashboard, no multi-machine view
- No automated alerting — if a temperature exceeds a threshold at 3 AM, nothing happens
- No historical trending across time without manual log management
- No AI analysis — HWiNFO presents numbers, does not interpret them
- Requires user presence to be useful — the program must be running on the local machine
- Not designed for deployment at scale across a fleet
Pricing: Free (personal use). $25 for Pro (logging).
Best suited for: Individual hardware diagnostics, benchmarking, enthusiast hardware monitoring on a single machine. Completely inadequate for fleet monitoring of more than 1–2 machines.
Open Hardware Monitor / LibreHardwareMonitor
What it is: Open Hardware Monitor is an open-source project that reads hardware sensors, similar to HWiNFO. LibreHardwareMonitor is the actively-maintained fork. Both expose sensor data via a web server interface that other tools can query.
What it does well:
- Open source and free
- Exposes sensor data via HTTP API, enabling integration with other monitoring tools
- Reasonably good sensor coverage (though less comprehensive than HWiNFO)
- Can be run as a Windows service for persistent operation
- Used as the sensor backend for PRTG custom sensors, Prometheus exporters, and other integrations
What it misses for fleet monitoring:
- Same local-only limitation as HWiNFO without additional infrastructure
- No built-in alerting
- No fleet dashboard
- No AI analysis
- Requires technical setup to integrate with fleet-level monitoring (Prometheus + Grafana, custom PRTG sensors, etc.)
- Development is community-driven with inconsistent sensor coverage for newer hardware
- Setup for fleet deployment requires custom scripting, infrastructure setup, and ongoing maintenance
Pricing: Free (open source).
Best suited for: Technically sophisticated IT teams who want to build a custom monitoring stack and are willing to invest in setup and maintenance. The backend sensor library that GGFix itself uses internally.
Side-by-Side Comparison
| Feature | PRTG | HWiNFO | Open Hardware Monitor | GGFix |
|---|---|---|---|---|
| Hardware sensor reading | Partial (with plugins) | Excellent | Good | Excellent |
| Fleet monitoring | Yes | No | No (without infra) | Yes |
| Cloud dashboard | Yes | No | No | Yes |
| Automated alerting | Yes | No | No | Yes |
| AI anomaly detection | No | No | No | Yes |
| Per-machine baselines | Manual | N/A | N/A | Automatic |
| Setup complexity | High | Low (single machine) | High (fleet) | Low |
| Remote visibility | Yes | No | Requires setup | Yes |
| S.M.A.R.T. monitoring | Partial | Yes | Partial | Yes |
| Battery monitoring | No | Yes | No | Yes |
| Free tier | 100 sensors | Yes | Yes | 3-day trial |
| Monthly cost (50 machines) | ~$150/month | N/A | Infrastructure cost | ~$600/month |
Which Tool for Which Use Case
You need to diagnose a single machine right now: HWiNFO. Download it, run it, get complete real-time sensor data immediately. Free.
You need to understand what sensors your hardware exposes: LibreHardwareMonitor or HWiNFO. Both give you a complete picture of what your hardware reports.
You already have PRTG and want hardware sensor monitoring too: Build custom PRTG sensors using LibreHardwareMonitor as the backend. Expect 4–8 hours of setup per machine type and ongoing maintenance when hardware changes.
You need fleet monitoring with automated alerting across 5+ machines: Neither HWiNFO nor Open Hardware Monitor are viable. PRTG can work with custom sensors but is expensive and complex. GGFix is purpose-built for this use case.
You want AI-powered anomaly detection, not just threshold alerts: Only GGFix provides this. PRTG, HWiNFO, and Open Hardware Monitor are all threshold-based tools that require you to know what thresholds to set.
Frequently Asked Questions
Can PRTG be configured to read the same sensors as HWiNFO?
With custom sensor plugins using LibreHardwareMonitor as a backend and PowerShell scripting, PRTG can be configured to read most hardware sensors. This requires approximately 2–4 hours of setup per unique machine configuration and ongoing maintenance when hardware drivers or LibreHardwareMonitor updates change sensor IDs. It is functional but significantly more complex than purpose-built hardware monitoring tools.
Is HWiNFO accurate for hardware diagnostics?
HWiNFO is widely regarded as the most accurate and comprehensive hardware sensor reader available for Windows. It is used by major hardware review sites (Tom's Hardware, AnandTech, TechPowerUp) as the reference tool for temperature and voltage measurements. If you need to know exactly what a specific sensor is reporting on a specific machine, HWiNFO is the most reliable source.
Does Open Hardware Monitor work on Windows 11?
LibreHardwareMonitor (the maintained fork) supports Windows 10 and Windows 11. The original Open Hardware Monitor project is no longer actively maintained and has limited support for hardware released after 2021. For any hardware released in the past 2–3 years, use LibreHardwareMonitor, not the original Open Hardware Monitor.
What is the most cost-effective way to monitor a 50-machine fleet?
At $12/machine/month (USD), GGFix costs $600/month for 50 machines — or $540/month on annual billing ($6,480/year). PRTG for equivalent hardware sensor coverage (assuming 40–60 sensors per machine = 2,000–3,000 sensors) costs $1,800–3,500/year in license fees plus significant setup and maintenance time. A custom Prometheus + LibreHardwareMonitor + Grafana stack is theoretically free but requires infrastructure hosting (~$50–200/month), initial setup (40–80 hours), and ongoing maintenance.
Should I use HWiNFO alongside GGFix?
Yes, for diagnostics. GGFix provides continuous monitoring, trending, and automated alerting across your fleet. HWiNFO is the right tool for deep real-time diagnostics on a specific machine when you are investigating an issue. They serve complementary purposes — GGFix for fleet health management, HWiNFO for hands-on local investigation.
Find out if your hardware has problems right now.
GGFix monitors 50+ sensors per machine plus the top 25 processes every minute, decodes BSODs into plain English, and pushes alerts to your phone in under 10 seconds.
- 3-day free trial — no credit card, 1 machine included
- Installs silently as a Windows Service (2 minutes)
- 50+ sensors + top 25 processes monitored every minute
- Auto-decodes BSODs and Event IDs 41 / 1001 / 219 / WHEA
- AI names the exact app that caused any crash or spike
- Telegram or email alerts in under 10 seconds
| Scenario | Typical cost (USD) |
|---|---|
| Emergency repair after hardware failure | $300 – $1,500 |
| Data recovery (worst case) | $500 – $2,500 |
| Lost workday per incident | $150 – $800 |
| Preventive maintenance (if flagged early) | $30 – $130 |
| GGFix monitoring (per machine / month) | $20 |
| GGFix monitoring (per machine / year — 2 months free) | $200 |
Early warning is the cheapest insurance you can buy. GGFix catches problems when the fix is still cheap — and names the exact app, sensor, or BSOD code responsible.
On-site PC & laptop repair · Copenhagen
In Copenhagen with this exact problem? GGFix fixes it hands-on — often cheaper than replacing the machine.
Fixed prices from 399 DKK for on-site PC and laptop repair, all brands, on-site or drop-off in Ishøj — with an honest diagnosis before you commit to anything.
See on-site PC and laptop repair pricesWriting about hardware monitoring, fleet management, and keeping machines alive. Powered by GGFix.
Related Articles
GPU Artifacts: What They Look Like and What Causes Them
GPU artifacts range from fixable driver issues to signs of permanent VRAM damage. Here is how to identify which type you have, what temperatures trigger them, and whether your graphics card is recoverable.
PC Maintenance Schedule: The Complete Checklist (Daily to Annual)
The complete PC maintenance schedule for businesses — weekly, monthly, quarterly, and annual tasks with time estimates, environment adjustments, and the real cost of skipping it.
NVIDIA RTX 4060–5090: Temperature Limits by Model
RTX 4090 and RTX 5090 have different temperature limits. The hotspot temperature runs 15-25°C above the core temperature every card reports. Most monitoring setups only watch the core — which means most monitoring misses the actual failure threshold. Here are the exact numbers for every RTX card.
[ free 3-day trial · no credit card ]
Know before it breaks.
GGFix installs in 2 minutes and starts watching your hardware immediately — CPU temps, GPU load, disk health, fan speeds, and 50+ sensors. AI tells you what's wrong before it causes damage.