Signs Your PC Hardware Is Degrading (And How to Catch Them Early)

Skipping maintenance doesn't save money — it defers a bigger bill.
Dust-clogged heatsinks and degraded thermal paste cause CPUs to run 15–25°C hotter than they should. GGFix detects rising baseline temps over time — the exact signal that maintenance is overdue — and tells you *which* machine to clean, not just that something is wrong somewhere.
Start 3-Day Free TrialNo card requiredSymptoms are lagging indicators. By the time a PC crashes, throttles visibly, or a user notices slowdown, the underlying hardware degradation has been building in sensor readings, SMART attributes, and voltage logs for weeks or months. The five-year mark is the statistical inflection point: Backblaze's 2024 drive data shows hard drive failure rates doubling to tripling after year five. Other components follow a similar curve — not failing suddenly, but accumulating damage that eventually crosses a threshold. This guide covers what those early signals look like per component, before they become failures. For the scheduled maintenance that catches these signals proactively, see our complete PC maintenance schedule guide.
Early Warning Signs: What to Watch
These eight signals consistently precede hardware failure by weeks to months. None of them require a specialist to detect — each is visible in free monitoring software or Windows built-in tools.
- CPU temperatures creeping 5–10°C higher over months under the same workload
- Thermal throttle events logging during normal use, not just peak gaming or rendering
- Any non-zero value in SMART attribute 05 (Reallocated Sectors) on any drive
- +12V rail fluctuating more than 5% under combined CPU and GPU load
- PCIe recovery count above zero on GPU
- NVMe spare capacity or wear indicator declining toward 10%
- Fan speeds erratic or spiking without corresponding workload change
- System instability under light loads, not heavy ones — the opposite of what overheating produces
The last item is the subtlest and the most diagnostic. Most people expect hardware problems to appear under stress. Instability that appears during web browsing or light document work — while heavy gaming is stable — points toward silicon voltage instability rather than thermal failure, a pattern that became prominent at scale with Intel's 13th and 14th generation CPUs.
CPU: Thermal Paste, Throttle Flags, and Voltage Drift
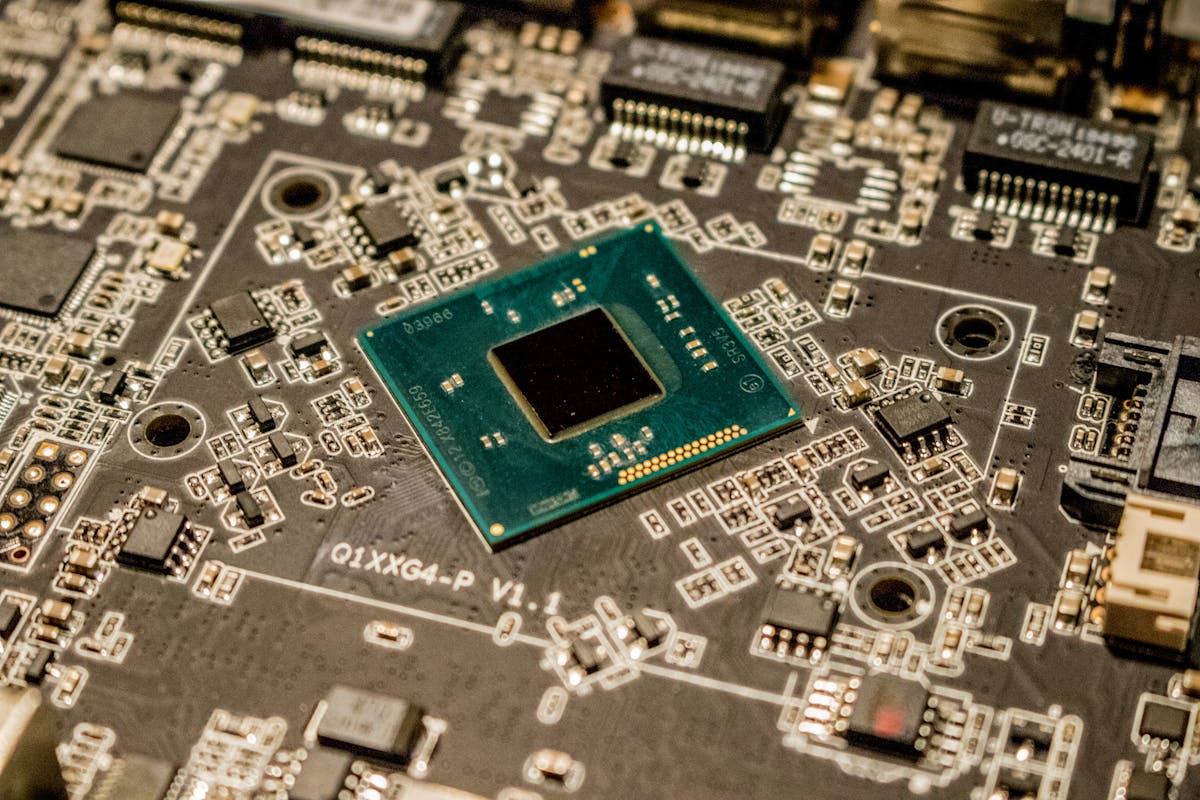
Thermal paste degradation is the most common and most preventable CPU degradation signal. Standard silicone thermal compound degrades noticeably within 3–5 years; premium metal-based compounds last up to 7 years. As the paste dries and cracks, thermal resistance between the CPU die and heatsink increases. The characteristic signature: idle temperatures remain normal, but load temperatures spike faster and higher than they did at installation. Mild degradation adds 3–7°C. Severe cases — where paste has cracked and partially lost contact — can add 20°C or more, pushing the CPU into sustained thermal throttling that cuts performance 15–30% without any error message or visible indication.
The monitoring approach: track CPU temperature under a consistent load (same benchmark, same ambient temperature) over consecutive months. A 2°C per month upward drift with no physical changes points to paste degradation. Our thermal paste replacement guide covers the re-application process. If you would rather not open the case yourself, our PC cleaning and thermal-paste service in Copenhagen handles the dust removal and re-paste on a bench.
CPU silicon voltage degradation is less common but more serious. In 2024, Intel confirmed that a microcode bug in 13th and 14th generation Raptor Lake processors caused the power management algorithm to request elevated voltages during specific operating states — accumulating what Intel calls "Vmin shift," a permanent increase in the minimum voltage at which the CPU operates stably. The damage is irreversible: affected chips require higher voltages to maintain stability, manifesting as application crashes and instability that appears under light workloads rather than heavy ones. Intel patched the microcode in September 2024 (version 0x12B) to prevent further damage, but could not repair already-degraded processors. AMD's Ryzen 7000 series experienced a similar class of issue in 2023 when EXPO memory profiles pushed SoC voltages above safe thresholds on certain motherboards.
The broader principle: CPUs running within their rated voltage and thermal envelope are designed for 10+ year operational life. It is elevated voltage — from firmware bugs, aggressive overclocking, or power management misconfiguration — that accelerates silicon aging into a human-perceivable timescale.
Storage: SMART Progression and the Year-Five Cliff
For mechanical hard drives, Backblaze's 2024 dataset (301,120 drives monitored) shows the age-related failure pattern clearly. Drives in their second to fourth years show stable, low failure rates of roughly 1.5–2% annually. At year five, the curve bends upward. The 8TB drives in Backblaze's fleet, averaging 7+ years old, hit a 3.04% annualized failure rate in Q3 2024 — more than double their mid-life rate. The 12TB drives moved from approximately 1% failure rate in 2021 to 3% in 2024 as they crossed the five-year threshold. This pattern repeats across manufacturers and drive sizes.
For drives approaching this age, SMART attribute monitoring is not optional — it is the only way to catch the early failure signal. Three attributes override everything else:
| SMART Attribute | ID | Action Threshold |
|---|---|---|
| Reallocated Sectors Count | 05 | Any value above zero |
| Current Pending Sector Count | 197 | Any value above zero |
| Uncorrectable Sector Count | 198 | Any value above zero |
A reallocated sector means the drive firmware identified a failing storage cell and remapped it to a spare. The first reallocated sector is the canary — most drive failures that begin with a non-zero count here will continue accumulating. Back up data immediately and plan replacement within 30 days.
For SSDs, the conventional concern — writing past the rated TBW (Terabytes Written) — is largely theoretical for office environments. A 600 TBW drive at a typical office write rate of 20 GB/day would take approximately 82 years to exhaust its rated endurance. The real SSD failure modes are controller failures and firmware bugs, not NAND wear-out. The useful indicator is the wear level or media wearout indicator (varies by manufacturer), which declines from 100 to 0 — action warranted below 10.
For NVMe drives, latency spikes appear before SMART failure indicators. When NAND error rates increase from normal wear, the drive's onboard error correction adds latency to fix bit errors before reporting them at the SMART level. The result: random file operations that were consistently fast become occasionally slow — backup jobs taking longer than usual, database queries with unexpected variance. This pattern appears weeks before any SMART attribute goes yellow. For a complete guide to reading SMART data and identifying which attributes predict failure, see our SMART data and SSD failure prediction guide.
GPU: Temperature Creep, VRAM Artifacts, and PCIe Recovery Count
GPU degradation follows a gradient from subtle to obvious. The subtle stage is easy to miss.
Temperature creep is the GPU equivalent of CPU thermal paste failure. As thermal pads between the GPU die and heatsink harden and lose conductivity over years, and as fan bearings wear, GPU temperatures under equivalent workloads rise year over year. A GPU that ran 74°C in 2021 running 82°C under identical workloads in 2026 is degrading, even if 82°C is technically within safe limits. The trend is the signal.
VRAM thermal stress became a documented concern with the RTX 3080 and 3090 (Ampere generation), where independent measurements showed GDDR6X memory junction temperatures exceeding 100°C under sustained load — above Micron's rated 95°C operating specification. Sustained operation above rated temperature accelerates the same Arrhenius-governed degradation that affects capacitors: higher temperature, faster wear. Early VRAM degradation produces intermittent artifacts — geometric patterns, colored blocks, corrupted textures — that appear and disappear depending on GPU temperature. Artifacts that worsen when the GPU is hot and improve after cooling are characteristic of VRAM thermal degradation rather than a driver issue. Artifacts that are consistent regardless of temperature point to driver or software problems.
PCIe recovery count is the least-known degradation signal and one of the most specific. When a PCIe connection between the GPU and motherboard encounters a transmission error, the system logs a recovery event. A count of zero is normal. Any count above zero indicates either a PCIe slot or GPU edge connector problem — worn contacts, debris, or in rare cases, actual PCIe lane degradation. This metric is visible in HWiNFO64 and is logged continuously by GGFix. It appears in no mainstream hardware guide but is a reliable early indicator of GPU or slot reliability problems.
PSU: The Component Nobody Monitors Until It Fails
Power supply failures are the most undermonitored degradation pathway in desktop PCs, because the failure is gradual and the early symptoms are indistinguishable from software problems.
The mechanism is electrolytic capacitor aging. Capacitors inside the PSU smooth the rectified AC power into clean DC voltage. As the liquid or gel electrolyte inside each capacitor slowly evaporates through its seal, the capacitor loses capacitance and gains internal resistance. It becomes less effective at filtering voltage ripple. The DC rails — nominally +12V, +5V, and +3.3V — begin to fluctuate under load.
The Arrhenius relationship quantifies this precisely: every 10°C reduction in operating temperature doubles the capacitor's rated lifetime. A budget PSU using 85°C-rated capacitors (common in sub-$60 units) running at 50°C internal ambient has an estimated service life of roughly six years under continuous operation. A quality PSU using 105°C-rated Japanese capacitors at the same internal temperature runs far longer. This is why two PSUs with identical wattage ratings behave very differently over five years.
The observable degradation signal before complete failure:
- The +12V rail sagging below 11.4V under combined CPU and GPU peak load (ATX specification allows ±5% — that is 11.4V to 12.6V)
- System instability that only occurs when both CPU and GPU are simultaneously under heavy load
- Crashes that appear random but consistently follow sustained high-wattage operation
- Coil whine that changes pitch or appears at unusual operating points
The definitive visual sign: capacitor tops should be flat. Any dome shape or visible bulging indicates internal pressure from expanding electrolyte — the capacitor has failed or is imminently failing. Dried brown or orange residue at the base of a capacitor is leaked electrolyte — definitive failure.
Voltage rail monitoring — checking +12V, +5V, and +3.3V during combined CPU+GPU load — is the proactive equivalent of watching SMART data for drives. GGFix logs voltage rails continuously from hardware sensor data, flagging deviations before they cascade into crashes.
RAM: Durable, But With a Known Failure Pattern
RAM is the most durable component in a typical PC. Under normal operating conditions, DRAM cells degrade on timescales of decades before hard errors accumulate. But it is not immune, and its failure mode is uniquely dangerous: silent data corruption.
Google's 2009 field study across a large production fleet found that more than 8% of DIMMs experienced at least one correctable memory error per year. A DIMM that experiences one correctable error is 13 to 228 times more likely to experience another within the same month — errors cluster. Consumer desktop RAM lacks error-correcting code (ECC), meaning these single-bit errors correct nothing — they either corrupt data silently, crash an application, or produce a BSOD.
The failure presentation:
- Random application crashes in memory-intensive software (video editors, browsers with many tabs, databases)
- Data file corruption that appears sporadic — corrupted saves, unexpected document errors
- BSODs with
MEMORY_MANAGEMENTorPAGE_FAULT_IN_NONPAGED_AREAstop codes - Errors that reproduce in MemTest86 at the same memory addresses every run indicate hard cell failures — physical damage. Errors at different addresses each run indicate soft errors (transient bit flips from cosmic ray events — real but unpredictable).
Practical risk: if RAM survives its first six months without errors, it will almost never fail during normal use. The dominant RAM failure risk is the rare manufacturing defect that passes initial testing but degrades under sustained operation. Overclocked or overvolted RAM accelerates cell wear; running RAM at its rated specifications makes failure over a 10-year ownership window unlikely.
The Trend Problem: Why Single Snapshots Miss Degradation
A CPU running at 79°C under load is not alarming in isolation. A CPU that ran 68°C under the same workload six months ago, now consistently at 79°C with no physical changes, is degrading — and in three more months it will be throttling.
A drive with 12 reallocated sectors may be stable. A drive that had 0 sectors three months ago, then 3, then 7, then 12, is actively failing and will reach complete failure within weeks to months.
This is the fundamental limitation of manual health checks: they capture the current state but not the direction. A monthly check that finds a CPU at 79°C flags nothing because 79°C is within normal range. A monitoring system that logged 68°C six months ago knows that 79°C represents an 11°C creep and alerts accordingly.
For the monthly manual check process that provides the current-state snapshot, see our 15-minute monthly PC health check guide. For persistent issues that cross the replacement threshold, our hardware lifecycle guide covers the replace-vs-repair decision framework.
GGFix monitors temperatures, SMART attributes, voltage rails, fan speeds, PCIe recovery counts, and throttle flags continuously — logging baselines and alerting on deviations. When a machine's CPU temperature has risen 8°C over four weeks with no software changes, that pattern appears in the fleet dashboard before any user reports a problem.
Component Lifespan and Degradation Reference
| Component | Typical Lifespan | Key Early Warning Signal | Action Threshold |
|---|---|---|---|
| HDD | 3–8 years | Reallocated Sector Count | Any value above zero |
| SSD | 5–10 years | Wear level indicator | Below 10% remaining |
| NVMe | 5–8 years | Latency spikes, spare capacity | Spare capacity < 10% |
| CPU | 10+ years (silicon) | Temperature creep, throttle flags | +8°C from baseline |
| GPU | 5–10 years | Temp creep, artifacts, PCIe recovery | Any PCIe recovery events |
| PSU | 5–10 years | +12V rail sag under load | Below 11.4V under load |
| Thermal paste | 3–5 years | Load temp spike without idle change | +5°C from baseline |
| RAM | 10+ years | MemTest errors, application crashes | Any reproducible hard errors |
The five-year mark applies broadly: drives, PSUs, and GPU thermal interfaces all show measurably increased failure or degradation rates past five years. A fleet maintenance plan should flag any machine with hardware older than five years for elevated monitoring frequency and prioritized replacement planning.
Frequently Asked Questions
How do I know if my PC hardware is degrading?
The most reliable early signals are temperature trends (rising under equivalent workloads), SMART attribute changes on drives (especially Reallocated Sector Count above zero), and voltage rail instability on the +12V line. Single-point readings are less useful than trends over weeks and months. A CPU that has risen 8°C over six months with no physical changes is degrading, even if the current temperature is within spec.
Does CPU performance degrade with age?
Under normal operating conditions, CPU silicon is designed for 10+ year operational life. The practical degradation that occurs is thermal paste drying (3–5 years), which causes temperature increases and thermal throttling — reducing effective performance while the chip itself remains undamaged. True silicon degradation (electromigration, NBTI, HCI) occurs at imperceptible rates within spec. The exception: CPUs run at elevated voltages — through overclocking or, as Intel's 2024 Raptor Lake case demonstrated, through firmware bugs — accumulate irreversible Vmin shift damage measurably faster.
What are the first signs of a failing hard drive?
SMART attribute 05 (Reallocated Sectors Count) turning non-zero is the earliest quantitative signal — it appears before any user-visible symptoms. Slow or inconsistent read times during file operations, longer boot times on a mechanical drive, and intermittent read errors in applications are the next stage. Audible clicking or grinding indicates physical head or platter damage — at this point, data recovery should be prioritized over diagnosis.
How long does PC hardware typically last before degrading?
Five years is the statistical inflection point for most mechanical and electronic components. Hard drive failure rates double to triple past year five (Backblaze 2024 data). PSU capacitors rated for 85°C operation at 50°C ambient have an estimated service life of approximately six years. Thermal paste needs replacement every 3–5 years. CPU and GPU silicon can last 10+ years within thermal and voltage specs. RAM is the most durable component, with hard failures being rare under normal conditions over a decade of use.
What does hardware degradation do to PC performance?
The most common effect is thermal throttling from dried thermal paste or dust accumulation — a CPU or GPU that has been running 10–15°C hotter than its original baseline will throttle clock speeds under sustained load, reducing performance 15–30% with no error message. SMART degradation on drives causes increased read/write latency before outright failure, manifesting as slow file operations and longer application load times. PSU voltage instability under load causes system crashes rather than gradual performance loss.
Is there software that detects hardware degradation automatically?
Free tools like CrystalDiskInfo (SMART data), HWiNFO64 (temperatures and voltages), and Windows Reliability Monitor provide point-in-time snapshots. Continuous monitoring tools like GGFix log all sensor data over time and alert on deviation from each machine's established baseline — temperature creep, SMART progression, voltage rail changes, fan anomalies, and PCIe recovery events are all tracked automatically without requiring a monthly manual check.
Find out if your hardware has problems right now.
GGFix monitors 50+ sensors per machine plus the top 25 processes every minute, decodes BSODs into plain English, and pushes alerts to your phone in under 10 seconds.
- 3-day free trial — no credit card, 1 machine included
- Installs silently as a Windows Service (2 minutes)
- 50+ sensors + top 25 processes monitored every minute
- Auto-decodes BSODs and Event IDs 41 / 1001 / 219 / WHEA
- AI names the exact app that caused any crash or spike
- Telegram or email alerts in under 10 seconds
| Scenario | Typical cost (USD) |
|---|---|
| Emergency repair after hardware failure | $300 – $1,500 |
| Data recovery (worst case) | $500 – $2,500 |
| Lost workday per incident | $150 – $800 |
| Preventive maintenance (if flagged early) | $30 – $130 |
| GGFix monitoring (per machine / month) | $20 |
| GGFix monitoring (per machine / year — 2 months free) | $200 |
Early warning is the cheapest insurance you can buy. GGFix catches problems when the fix is still cheap — and names the exact app, sensor, or BSOD code responsible.
On-site PC & laptop repair · Copenhagen
In Copenhagen with this exact problem? GGFix fixes it hands-on — often cheaper than replacing the machine.
Fixed prices from 399 DKK for on-site PC and laptop repair, all brands, on-site or drop-off in Ishøj — with an honest diagnosis before you commit to anything.
See on-site PC and laptop repair pricesWriting about hardware monitoring, fleet management, and keeping machines alive. Powered by GGFix.
Related Articles
GPU Artifacts: What They Look Like and What Causes Them
GPU artifacts range from fixable driver issues to signs of permanent VRAM damage. Here is how to identify which type you have, what temperatures trigger them, and whether your graphics card is recoverable.
PC Maintenance Schedule: The Complete Checklist (Daily to Annual)
The complete PC maintenance schedule for businesses — weekly, monthly, quarterly, and annual tasks with time estimates, environment adjustments, and the real cost of skipping it.
NVIDIA RTX 4060–5090: Temperature Limits by Model
RTX 4090 and RTX 5090 have different temperature limits. The hotspot temperature runs 15-25°C above the core temperature every card reports. Most monitoring setups only watch the core — which means most monitoring misses the actual failure threshold. Here are the exact numbers for every RTX card.
[ free 3-day trial · no credit card ]
Know before it breaks.
GGFix installs in 2 minutes and starts watching your hardware immediately — CPU temps, GPU load, disk health, fan speeds, and 50+ sensors. AI tells you what's wrong before it causes damage.