The 15-Minute Monthly PC Health Check: A Complete Checklist
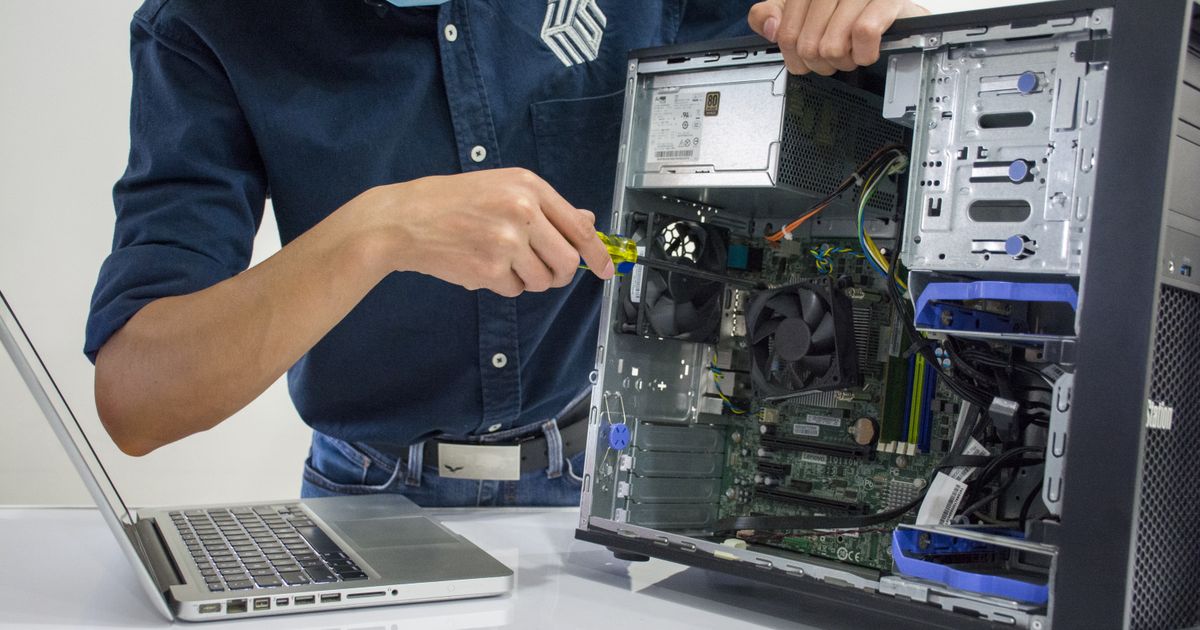
One offline machine during a deadline costs more than a year of monitoring.
With a fleet you can't physically check every machine every day, and most RMMs show 'online' right up until the moment a workstation blue-screens from thermal shutdown. GGFix watches the hardware layer — sensors, processes, BSODs decoded into plain English — and pushes alerts to whoever is on-call. Whether you have 3 machines or 300.
Start 3-Day Free TrialNo card requiredMost PC health checks fail for the same two reasons: no time limit and no pass/fail criteria. The result is an open-ended inspection that either balloons into an hour or gets skipped entirely. This checklist runs in 15 minutes, gives a binary pass or fail for each item, and specifies exactly what action to take on a fail. It is part of the broader maintenance schedule covered in our complete PC maintenance guide.
What You Need Before You Start
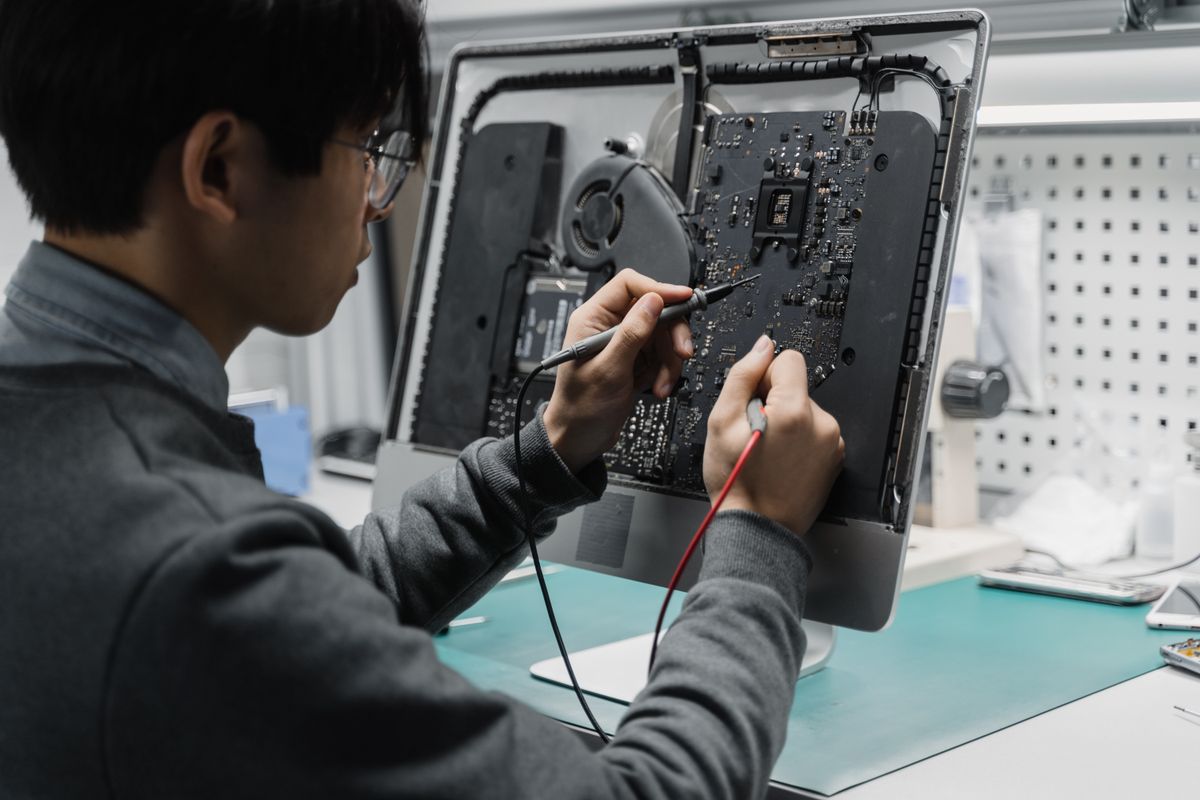
Four tools cover every check on this list. Two are already installed on every Windows machine.
Built-in (zero install):
- Windows Reliability Monitor — Run dialog:
perfmon /rel. A 28-day visual timeline of crashes, errors, and hardware failures. - Event Viewer — Run dialog:
eventvwr.msc. The hardware error log that Windows keeps whether you look at it or not. - Task Manager — Ctrl+Shift+Esc. CPU, RAM, disk, and fan data at a glance.
- Windows Security — Search "Windows Security". Antivirus, firewall, and device health in one panel.
Free downloads (one-time, takes 2 minutes):
- CrystalDiskInfo (crystalmark.info) — Reads drive SMART data instantly. No scan required. Opens in seconds and shows health status for every connected drive.
- HWiNFO64 (hwinfo.com) — Reads every hardware sensor your system exposes: CPU temperatures per core, GPU temperatures including hotspot, fan RPM for every connected fan, voltage rails, and NVMe drive temperatures.
Windows 11 24H2 bonus: Settings > System > Storage > Advanced Storage Settings > Disks & Volumes > Properties now shows NVMe drive health natively — Estimated Remaining Life, current temperature, and available spare capacity — without any third-party tool.
The 15-Minute Monthly PC Health Check Checklist
Step 1: CPU Temperature — 2 Minutes
Tool: HWiNFO64 (Sensors window, CPU Package row)
Launch HWiNFO64, open the Sensors window, and let it run for 2 minutes under normal workload. Read the "Max" column for CPU Package temperature — this captures the thermal peak, not just the current moment.
Pass: CPU Package max below 80°C under office load. Fail — Warning: Max above 80°C. Schedule a dust clean within the next 2 weeks. Check CPU fan is spinning. Fail — Critical: Max above 90°C. The CPU is throttling now. Stop and clean the machine before returning it to service. Our PC dust cleaning guide covers the process step by step.
For standard office CPUs (Core i5/i7, Ryzen 5/7), sustained load temperatures above 85°C indicate a blocked heatsink, failed fan, or dried thermal paste. These are the same warning and critical thresholds GGFix uses in production for real-time monitoring alerts. If a machine keeps failing this check after a clean and you are in Copenhagen, GGFix offers fixed-price PC cleaning and thermal-paste service with a before/after temperature benchmark.
Step 2: Drive Health (SMART Status) — 2 Minutes
Tool: CrystalDiskInfo (or Settings > Disks & Volumes on Windows 11 24H2 for NVMe)
Open CrystalDiskInfo. It reads existing SMART data from drive firmware instantly — there is no scan to wait for. Check the color-coded health status for every connected drive.
Pass: All drives show Blue — "Good". Fail — Caution: Any drive shows Yellow — "Caution". Back up all data on that drive today. Schedule replacement within 30 days. Fail — Critical: Any drive shows Red — "Bad". Back up immediately and replace before the machine is used again.
Three SMART attributes override the overall status — if any of these are non-zero, treat the drive as failed regardless of what CrystalDiskInfo shows overall:
| Attribute ID | Name | Threshold |
|---|---|---|
| 05 | Reallocated Sectors Count | Any value > 0 |
| 197 | Current Pending Sector Count | Any value > 0 |
| 198 | Uncorrectable Sector Count | Any value > 0 |
For a deeper explanation of what each SMART attribute means and how to read trend data over time, see our SMART data and SSD failure prediction guide.
Step 3: Windows Reliability Monitor — 90 Seconds
Tool: Run dialog → perfmon /rel
Reliability Monitor displays a 28-day stability timeline scored from 1 (unstable) to 10 (stable). Scan the chart from left to right. Red circles mark critical events: BSODs, kernel crashes, hardware failures, and unexpected shutdowns.
Pass: Stability score 7 or above with no clusters of red circles in the past 30 days. Fail: Score below 7, or 3+ red circles within a 7-day window. Open Event Viewer to identify the root cause (Step 4).
A single red circle from a power outage or accidental shutdown is not a concern. A recurring pattern of red circles — especially on the same days of the week or under the same workloads — indicates a repeating hardware or driver fault.
Step 4: Event Viewer — Hardware Errors — 2 Minutes
Tool: Run dialog → eventvwr.msc
Navigate to Windows Logs > System. Click "Filter Current Log" and enter these Event IDs: 41, 51, 11, 7, 1001. Set the time range to the last 30 days.
| Event ID | Source | Meaning |
|---|---|---|
| 41 | Kernel-Power | System shut down without a clean shutdown — crash, thermal cutoff, or power loss |
| 51 | Disk | I/O error during disk operation — can indicate storage, RAM, or motherboard issue |
| 11 | Disk / atapi | Disk controller error detected |
| 7 | Disk | Bad block detected on drive |
| 1001 | WerFault | Crash dump written — Windows recorded a hardware or driver fault |
Pass: Zero occurrences of IDs 11, 7, or 51. Isolated ID 41 from a known power event is acceptable. Fail: Any ID 11, 7, or 51 in the past 30 days. Any recurring ID 41 (3+ events). Investigate root cause before next maintenance window.
If you see WHEA-Logger events (IDs 1, 17, 18, 19, 46, or 47), treat them as critical — these indicate physical hardware faults at the CPU, memory bus, or PCIe level.
Step 5: RAM Usage and Stability — 1 Minute
Tool: Task Manager (Performance tab)
Open Task Manager, click the Performance tab, select Memory. Read the "In Use" value at normal idle and under typical office workload.
Pass: RAM usage below 85% during normal workload. Fail — Warning: RAM consistently above 85% at idle. Investigate which processes are holding memory (Resource Monitor > Memory tab, sort by Commit). Fail — Critical: RAM above 90% at idle. Windows begins aggressive pagefile growth above 90%, causing disk I/O spikes that manifest as system-wide slowness. RAM is undersized for the current workload.
On machines running modern browsers with 10+ tabs plus an Office application, 8 GB of RAM is frequently insufficient. The monthly check often reveals machines where users have been experiencing slow performance for weeks without connecting it to RAM saturation.
Step 6: Storage Space — 1 Minute
Tool: File Explorer or Settings > Storage
Check the system drive (C:) free space percentage.
Pass: System drive less than 80% full. Fail — Warning: System drive 80–85% full. Run Storage Sense (Settings > Storage > Storage Sense) to clean temp files, Windows update caches, and Recycle Bin contents. Fail — Critical: System drive above 85% full. At this level, SSD performance degrades significantly — sequential read and write speeds can drop 50–90% as overprovisioning space is consumed. Address before the next work session.
HDDs below 80% free also fragment aggressively and lose the ability to write to large contiguous blocks, causing random access performance to degrade.
Step 7: Fan Speeds — 1 Minute
Tool: HWiNFO64 (Sensors window, fan RPM rows)
In the HWiNFO64 sensors window, locate the fan speed rows for the CPU fan, chassis fans, and GPU fan. All fans that should be spinning will show a current RPM value.
Pass: All fans show non-zero RPM values. Fan speeds are proportional to temperatures (higher temps = higher RPM). Fail: Any fan shows 0 RPM that should be spinning. A chassis fan that has stopped is a warning. A CPU fan or GPU fan at 0 RPM is a critical failure — the machine should not be used under load until the fan is replaced or confirmed as working.
A fan bearing failure produces either silence (seized bearing) or a rhythmic grinding or rattling sound. A physical listen while HWiNFO is open takes 20 seconds and catches cases where the sensor still shows a historical value rather than a live reading.
Step 8: Windows Update Status — 1 Minute
Tool: Settings > Windows Update
Pass: System is current, or has updates pending that are scheduled to install. Fail: Last successful update was more than 30 days ago. Updates are failing silently — check the update history for error codes and resolve before leaving the machine.
The mean time from vulnerability disclosure to active exploitation in the wild has dropped to five days (Google Cloud Threat Intelligence, 2024). A machine 30+ days behind on patches is not a theoretical risk — it is statistically likely to have open attack vectors that are already being actively exploited.
Step 9: Windows Security Status — 30 Seconds
Tool: Search "Windows Security" or the shield icon in the taskbar
Pass: All protection areas show green checkmarks — Virus & threat protection, Account protection, Firewall & network protection, App & browser control, Device security. Fail: Any area shows yellow (warning) or red (action required). Address immediately — do not defer.
A yellow status on "Virus & threat protection" typically means definitions are outdated or real-time protection was disabled. A red status on "Device security" may indicate Secure Boot or TPM configuration issues, both of which affect Windows 11 security guarantees.
Step 10: Backup Verification — 1 Minute
Tool: Your backup software dashboard, or Settings > System > Backup
Pass: A successful backup completed within the last 7 days. Fail — Warning: Last successful backup is 7–30 days old. Check whether the backup job is still running and if storage is available. Fail — Critical: No successful backup in the last 30 days, or the last backup shows as failed. Investigate backup configuration immediately. Veeam's 2024 Data Protection Trends Report found that only 1–3% of organizations could restore systems within one day of a major outage — backup jobs that appear to be running but have not been verified are the primary reason.
Quick Reference: Pass/Fail Thresholds
| Check | Pass | Fail (Warning) | Fail (Critical) |
|---|---|---|---|
| CPU temperature (load) | < 80°C | 80–90°C | > 90°C |
| GPU hotspot temperature | < 95°C | 95–105°C | > 105°C |
| Drive SMART status | Blue / Good | Yellow / Caution | Red / Bad |
| SMART IDs 05, 197, 198 | = 0 | Any > 0 | Any > 0 |
| Reliability Monitor score | ≥ 7 | 5–7 with red circles | < 5 |
| Event ID 41 (30 days) | 0–1 isolated | 2–3 | 3+ or recurring |
| RAM usage (idle) | < 85% | 85–90% | > 90% |
| System drive fullness | < 80% | 80–85% | > 85% |
| Fan speeds | All non-zero | N/A | Any at 0 RPM |
| Last Windows update | < 30 days | 30–60 days | > 60 days |
| Last backup | < 7 days | 7–30 days | > 30 days |
The CPU and GPU temperature thresholds in this table are the same values GGFix uses for real-time production alerts — the same numbers that fire a Telegram or Slack notification when a fleet machine crosses a threshold at 3 AM.
What These Checks Look Like Over Time
The checklist above captures a point-in-time snapshot. Point-in-time data is useful for immediate triage. It is not useful for catching gradual failure.
A drive with 12 reallocated sectors is a problem. A drive that had 0 reallocated sectors in January, 3 in February, 7 in March, and 12 in April is a drive that is actively failing — and the monthly check caught the pattern four months before it would have produced symptoms a user notices.
For hardware monitoring alert thresholds and how to configure meaningful warnings based on trends rather than point-in-time values, see our hardware monitoring alert thresholds guide.
Scaling This to a Fleet
At one machine: 15 minutes per month. At 20 machines: 5 hours per month of manual health check time, assuming nothing fails. At 50 machines: not feasible as a manual process without dedicated staffing.
GGFix runs every item in this checklist continuously — CPU temperatures every 60 seconds, SMART data on every telemetry upload, fan speeds logged in real time, RAM and storage thresholds monitored 24/7. When a machine crosses a threshold, an alert fires immediately. There is no monthly slot to wait for, and no machine silently degrading between check-ins.
For the full office maintenance calendar that situates the monthly health check within a broader quarterly and annual schedule, see our office PC service maintenance calendar.
Frequently Asked Questions
How often should you do a PC health check?
Monthly for office and business machines. Quarterly is the minimum for home PCs with light use. Machines in high-stress environments — dusty workshops, video rendering stations, machines running 24/7 — benefit from a quick fortnightly check focused on temperatures and fan speeds. The monthly cadence catches most thermal and storage problems before they cause user-visible symptoms.
What does a PC health check include?
A complete monthly PC health check covers CPU temperature, drive SMART status, Windows Reliability Monitor history, Event Viewer hardware errors, RAM usage, storage space, fan speeds, Windows Update status, antivirus and security status, and backup verification. Using the tools listed above, the full check takes 12–15 minutes per machine.
What is a warning sign that a PC needs immediate attention?
Four findings require same-day action regardless of when the next scheduled maintenance is: any non-zero SMART value in attributes 05, 197, or 198; a CPU or GPU fan reading 0 RPM; CPU temperature above 90°C under normal load; or Windows Security showing any red protection area. Anything else from the checklist can be scheduled within the next 7–14 days.
Can a PC health check be automated?
Most of it, yes. Hardware temperature monitoring, fan speed monitoring, SMART health tracking, RAM usage tracking, and storage thresholds can all be monitored continuously with software like GGFix rather than checked manually each month. The parts that cannot be automated are physical inspection (listening for fan noise, checking cable condition) and backup restore verification (which requires a human to confirm the data is actually there and usable).
What temperature is too hot for a PC?
For standard desktop CPUs (Core i5/i7, Ryzen 5/7): above 80°C under sustained office load is a warning; above 90°C is critical and the machine is likely throttling. For GPUs: core temperature above 80°C under load warrants investigation; hotspot temperature above 95°C is a warning, and above 105°C is critical. Idle temperatures should be below 50°C for CPUs and below 45°C for GPUs in a properly cooled machine.
Stop checking machines manually. Watch all of them at once.
GGFix gives you a single dashboard for your entire fleet — sensors, processes, and decoded BSODs across every machine — with AI-powered alerts that push to Telegram or your PSA webhook.
- 3-day free trial — no credit card, 1 machine included
- Installs silently as a Windows Service (2 minutes)
- 50+ sensors + top 25 processes monitored every minute
- Auto-decodes BSODs and Event IDs 41 / 1001 / 219 / WHEA
- AI names the exact app that caused any crash or spike
- Telegram or email alerts in under 10 seconds
| Scenario | Typical cost (USD) |
|---|---|
| Emergency repair after hardware failure | $300 – $1,500 |
| Data recovery (worst case) | $500 – $2,500 |
| Lost workday per incident | $150 – $800 |
| Preventive maintenance (if flagged early) | $30 – $130 |
| GGFix monitoring (per machine / month) | $20 |
| GGFix monitoring (per machine / year — 2 months free) | $200 |
Early warning is the cheapest insurance you can buy. GGFix catches problems when the fix is still cheap — and names the exact app, sensor, or BSOD code responsible.
On-site PC & laptop repair · Copenhagen
In Copenhagen with this exact problem? GGFix fixes it hands-on — often cheaper than replacing the machine.
Fixed prices from 399 DKK for on-site PC and laptop repair, all brands, on-site or drop-off in Ishøj — with an honest diagnosis before you commit to anything.
See on-site PC and laptop repair pricesWriting about hardware monitoring, fleet management, and keeping machines alive. Powered by GGFix.
Related Articles
GPU Artifacts: What They Look Like and What Causes Them
GPU artifacts range from fixable driver issues to signs of permanent VRAM damage. Here is how to identify which type you have, what temperatures trigger them, and whether your graphics card is recoverable.
PC Maintenance Schedule: The Complete Checklist (Daily to Annual)
The complete PC maintenance schedule for businesses — weekly, monthly, quarterly, and annual tasks with time estimates, environment adjustments, and the real cost of skipping it.
NVIDIA RTX 4060–5090: Temperature Limits by Model
RTX 4090 and RTX 5090 have different temperature limits. The hotspot temperature runs 15-25°C above the core temperature every card reports. Most monitoring setups only watch the core — which means most monitoring misses the actual failure threshold. Here are the exact numbers for every RTX card.
[ free 3-day trial · no credit card ]
Know before it breaks.
GGFix installs in 2 minutes and starts watching your hardware immediately — CPU temps, GPU load, disk health, fan speeds, and 50+ sensors. AI tells you what's wrong before it causes damage.