DaVinci Resolve Hardware Requirements: What Actually Limits Performance
GPU crashes that 'seem random' always have a pattern.
Hotspot temps, VRAM pressure, power throttling, and the app running at the moment of the crash — these show up in sensor and process data weeks before the failure. GGFix logs every reading so you can see exactly what happened, *and which app was responsible*, and stop it from happening again.
Start 3-Day Free TrialNo card requiredDaVinci Resolve is simultaneously a video editor, color grading suite, visual effects compositor, and audio editor. It can use your GPU, CPU, RAM, and storage to their absolute limits — sometimes all at once.
This guide explains exactly what hardware limits performance in each part of Resolve's workflow, what to monitor, and how to know when hardware is the problem versus a project settings issue.
How DaVinci Resolve Uses Your Hardware
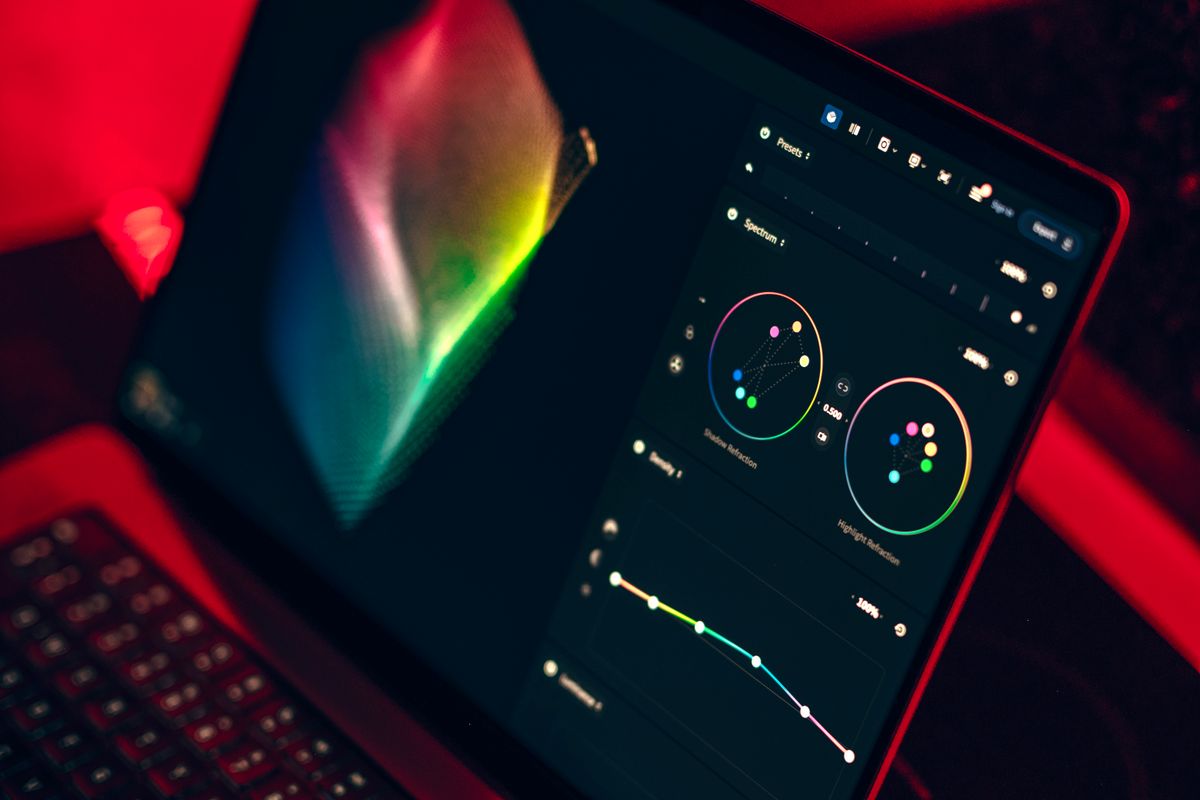
Resolve has a fundamentally different architecture from Premiere Pro or Final Cut Pro. It was built from the ground up around GPU processing.
GPU: Does the heavy lifting for playback, color processing, noise reduction, and Fusion effects. Resolve benefits from VRAM more than almost any other NLE.
CPU: Manages project I/O, certain decode operations, Fairlight audio, and CPU-based effects. Also handles media management tasks in the background.
RAM: Used for project data, media cache, and the Resolve timeline cache. 32GB is a functional minimum; 64GB makes a significant difference for complex timelines.
Storage: The most commonly overlooked bottleneck. Slow storage creates dropped frames, playback stutters, and export stalls even when GPU and CPU are underloaded.
Bottleneck 1: The Edit Page (Timeline Playback)
What Limits Playback
On the Edit page, the main bottleneck is usually storage I/O or media decode.
For native camera formats (BRAW, R3D, ProRes, H.264/HEVC), Resolve must decode each frame as it plays. Some formats are GPU-accelerated (BRAW, H.264 on NVIDIA), some are CPU-only.
H.264 and H.265 (HEVC) from cameras is CPU-intensive to decode. Playing back multiple H.264 streams in a complex timeline can max out your CPU purely on decode operations.
BRAW (Blackmagic RAW) uses GPU-accelerated decode. It plays back smoothly but requires VRAM for frame buffering.
The Storage Bottleneck
This is where most editors lose time and don't realize it. Resolve is reading media files from disk constantly during playback. If your storage can't keep up:
- Frames drop during playback
- Scrubbing is slow and stuttery
- Audio goes out of sync
Minimum storage performance for DaVinci Resolve:
- 1080p H.264: ~50 MB/s read sustained (any modern SSD easily handles this)
- 4K ProRes 422: ~200-300 MB/s read sustained (NVMe SSD needed)
- 4K BRAW: ~300-500 MB/s read sustained (fast NVMe SSD needed)
- 8K RAW from production cameras: 800MB/s+ (requires NVMe RAID or high-end NVMe)
How to tell if storage is your bottleneck: Open Task Manager or a hardware monitor while experiencing playback issues. If disk utilization hits 100% and read speed maxes out while GPU and CPU are under 50%, storage is the problem.
Monitoring During Edit Page Work
- GPU load: Should be 30-70% during complex timeline playback. Higher is better (means GPU is processing, not waiting).
- Storage read speed: Should be able to sustain the bitrate of your media
- CPU load: Watch for specific cores maxing out on H.264 decode while others are idle
Bottleneck 2: The Color Page
The Color page is where Resolve's GPU architecture shines. Every color operation you apply runs on the GPU in real-time.
VRAM Is the Critical Resource on the Color Page
Resolve keeps the current clip, color LUTs, noise reduction models, and effect data in VRAM simultaneously. As you stack nodes, the VRAM requirement grows.
Real-world VRAM requirements for Color page work:
- Basic grading with LUTs: 4-6GB VRAM
- Complex node trees with multiple ResolveFX: 8-12GB VRAM
- Multiple clips in split-screen comparison: 12-16GB VRAM
- 4K with film grain + noise reduction + power windows: 16GB+ VRAM recommended
When you run out of VRAM, Resolve doesn't crash — it falls back to RAM or drops frame rate. You'll notice:
- Real-time playback at 4K drops to 2K or below
- Playback frame rate drops below your timeline rate
- The interface becomes slow to respond during grading operations
GPU Temperature During Color Grading
Color grading sessions can run for hours with the GPU at continuous high load. If your GPU's cooling has degraded, you'll notice performance getting progressively worse through a long session — thermal throttling reducing GPU clock speeds.
Monitoring tip: Check if your GPU hotspot temperature stabilizes or keeps climbing during long grading sessions. A hotspot that stabilizes (say, at 82°C) means cooling is keeping up. One that climbs from 75°C to 88°C over 2 hours means it's not.
Bottleneck 3: Fusion (Visual Effects)
Fusion uses GPU for compositing and CPU for certain operations. It's generally the most hardware-intensive part of Resolve.
Key Fusion hardware requirements:
- 3D compositing and particles: Heavy GPU, benefits from high VRAM
- Particle systems: CPU-heavy, benefits from many cores
- 3D text and geometry: GPU-based, VRAM-intensive
- MediaIn/MediaOut with heavy color nodes: Layers GPU load from Color page on top of Fusion work
Fusion and Thermal Management
Fusion renders are intensive enough to trigger thermal issues that Color grading alone might not. If your machine:
- Works fine for color grading but crashes or throttles in Fusion
- Handles simple Fusion work but fails with complex particle systems or 3D compositing
...this is often a thermal profile issue. Fusion simply draws more power and generates more heat than the Color page.
Bottleneck 4: Export and Delivery
Resolve's Deliver page uses both GPU and CPU depending on the output format.
GPU-accelerated exports: H.264 (NVENC/AMF), H.265 (NVENC/AMF/QuickSync), BRAW
CPU-dependent exports: Some ProRes flavors, MXF, certain codec configurations
Why Export Times Vary Dramatically
A 30-minute timeline that exports in 8 minutes on one machine might take 45 minutes on another with similar specs. Common reasons:
- NVENC vs. software encoding: Using GPU hardware encoding (NVENC on NVIDIA, AMF on AMD) is 3-5x faster than CPU software encoding for H.264/H.265
- Thermal throttling: A GPU running hot exports much slower because it's throttling clock speeds
- Storage write speed: Exporting to a slow drive creates a write bottleneck even if GPU is fast
- Project cache: An uncached timeline requires color processing at export time; a cached one exports the pre-processed frames
Monitoring Export Performance
- Watch GPU and CPU during export to identify which is the active bottleneck
- Compare actual export speed vs. expected for your hardware
- If export speed decreases as time goes on, thermal throttling is slowing the process
Common DaVinci Resolve Hardware Problems and Their Signs
"Resolve is slow but not crashing"
Most likely cause: Thermal throttling. The GPU or CPU is running hot and reducing clock speeds to stay within thermal limits. Everything works, just at 50-60% of normal speed.
How to diagnose: Compare actual GPU boost clock during export vs. the GPU's rated boost clock. If your RTX 4080 is rated at 2.5 GHz boost but running at 1.8 GHz under load, it's throttling.
"Resolve crashes during complex color grading"
Most likely cause: VRAM overflow (scene got too complex) or GPU thermal crash (long session pushed temps too high).
How to diagnose: Check GPU VRAM usage with a monitoring tool during the session. Also check GPU hotspot — above 90°C during a crash indicates thermal.
"Playback frame rate varies day to day"
Most likely cause: Thermal state of the machine when you start working. If the machine was already warm from other work, baseline temps are higher and throttling kicks in sooner.
How to diagnose: Compare GPU temps at the start of a session on a "good" day vs. a "bad" day.
"Export failed mid-way through"
Most likely cause: GPU thermal crash (especially on long exports), storage write failure, or RAM error during frame buffering.
Recommended Monitoring Setup for DaVinci Resolve Workstations
For professional Resolve workstations, monitor these sensors continuously:
| Sensor | Why It Matters | Warning Threshold |
|---|---|---|
| GPU Hotspot | Thermal throttle/crash | >88°C |
| VRAM Temperature | VRAM stability | >90°C |
| GPU Clock (actual vs. rated) | Throttling detection | <80% of rated boost |
| CPU Package | Export throttling | >90°C |
| NVMe Temperature | Cache/media drive | >70°C |
| SSD Wear Indicator | Storage longevity | <30% remaining |
| RAM Error Count | Corrupt renders | Any non-zero |
For studios running Resolve on multiple machines, fleet-wide monitoring provides an overview of every workstation's health without needing to log into each one. Thermal issues that would require manual checking are surfaced automatically as alerts.
Summary: The Hardware Priority List for Resolve
- GPU VRAM: More is better. 16GB is the professional standard for 4K work.
- GPU cooling: Sustained performance requires thermals under control. Get repasted if running hot.
If you are in Copenhagen and your GPU is running hot, GGFix offers fixed-price graphics card repair and repaste. 3. Storage speed: NVMe SSD for media; dedicated cache drive improves responsiveness significantly. 4. System RAM: 64GB for professional 4K work, 32GB minimum. 5. CPU: Resolve is GPU-first, but CPU affects decode speed and export for non-hardware-accelerated formats.
Monitoring these metrics during real workflows (not benchmarks) shows you where bottlenecks actually occur in your specific project types.
Find out what's really causing your GPU crashes — including which app.
GGFix logs every sensor reading and the top 25 processes every minute, so when a crash happens you can see exactly what caused it: the temperature, the responsible application, and the Event Log entry — all in one place.
- 3-day free trial — no credit card, 1 machine included
- Installs silently as a Windows Service (2 minutes)
- 50+ sensors + top 25 processes monitored every minute
- Auto-decodes BSODs and Event IDs 41 / 1001 / 219 / WHEA
- AI names the exact app that caused any crash or spike
- Telegram or email alerts in under 10 seconds
| Scenario | Typical cost (USD) |
|---|---|
| GPU replacement (after preventable failure) | $600 – $2,500 |
| Lost render time (crashes per week) | $250 – $800 |
| Emergency technician + diagnosis | $120 – $400 |
| Preventive maintenance (when flagged early) | $50 – $130 |
| GGFix monitoring (per machine / month) | $20 |
| GGFix monitoring (per machine / year — 2 months free) | $200 |
Early warning is the cheapest insurance you can buy. GGFix catches problems when the fix is still cheap — and names the exact app, sensor, or BSOD code responsible.
On-site PC & laptop repair · Copenhagen
In Copenhagen with this exact problem? GGFix fixes it hands-on — often cheaper than replacing the machine.
Fixed prices from 399 DKK for graphics card repair, all brands, on-site or drop-off in Ishøj — with an honest diagnosis before you commit to anything.
See graphics card repair pricesLaxman Rawal
Writing about hardware monitoring, fleet management, and keeping machines alive. Powered by GGFix.
Related Articles
PSU Failure Signs: When Your Power Supply Is Dying
A dying PSU is the most misdiagnosed component in PC repair. Voltage instability, load-specific crashes, and USB dropouts are the real warning signs — here is what the ATX spec requires, how long quality units actually last, and which diagnostic tools work.
The Real Cost of Hardware Failure: A Business Impact Analysis
Hardware failure costs 5-10x the price of the broken component when you count downtime, lost productivity, data recovery, and emergency labor. This analysis breaks down the real numbers for small and mid-sized businesses.
PC Troubleshooting Guide: Diagnose and Fix Hardware Problems
The complete starting point for diagnosing PC hardware problems. Covers every major symptom and component failure, with step-by-step diagnostic approaches and links to in-depth guides.
[ free 3-day trial · no credit card ]
Know before it breaks.
GGFix installs in 2 minutes and starts watching your hardware immediately — CPU temps, GPU load, disk health, fan speeds, and 50+ sensors. AI tells you what's wrong before it causes damage.